Analytics:
Analytics is used to make an enhanced decision by converting useful information from the various raw data (unused or useless data). The difference between analysis and analytics – Analysis is processing something that happened in the past (historical view). Analytics is used for predicting future happenings.
Analytics are broadly classified into
- On the basis of insight offered – Analytics is used to give a solution for Financial, marketing analysis, business analytics and data.
- On the basis of business function/domain function. Eg: HR analytics, financial analytics, sales analytics, supply chain analytics & risk analytics.
- On the basis of industry. Eg: FMCG, E-commerce, banking, trading, Web analytics, other sectors like power, Hotel, telecom, airline, mining etc.

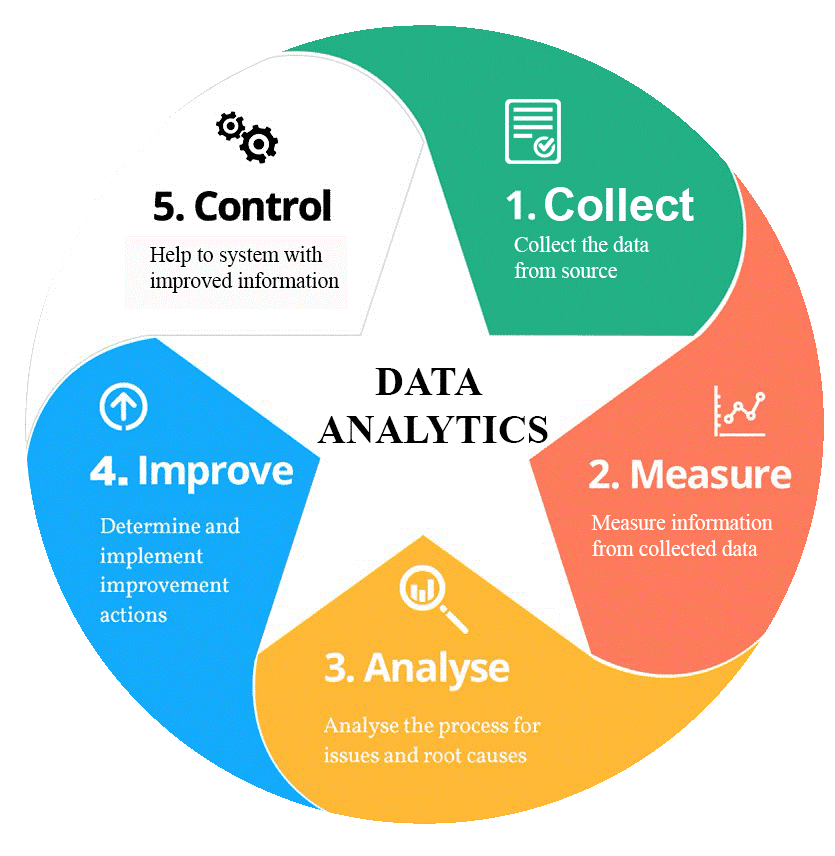
Various steps in an analytics project include
- Problem definition
- Data exploration
- Data preparation
- Modelling
- Validation of data
- Implementation and tracking
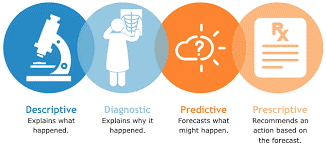
Types of analytics:
- Descriptive analytics answers, “What happened?”
- Diagnostic analytics answers, “Why did something happen?”
- Predictive analytics answers, “What is likely to happen?”
- Prescriptive analytics answers, “What action should be taken?”
Descriptive + diagnostic + predictive analysis = prescriptive analysis.
Digital Marketing Course Certification by Henry Harvin®
45-min online masterclass with skill certification on completion
 Book Free Strategy Call
$99 FREE
Access Expires in 24Hrs
Upcoming Batches of Marketing Analytics Certification :-
| Batch | Mode | Price | To Enrol |
|---|---|---|---|
| Starts Every Week | Live Virtual Classroom | 15000 | ENROLL NOW |
undoubtedly, there are more types of analytics are in the field out of which majorly occupied communities are mentioned the following
Business analytics:
Business analytics is the process of ordering, sorting, processing, and reviewing business data, and using statistical models and iterative methodologies to transform data into business insights.
Examples: FMCG, banking, insurance, government etc.
Business Analyst Skills
- Statistical analysis software understanding
- Programming skills
- Use of survey/query software and tools
- Business intelligence and reporting
- Data mining and visualization
- Analytic problem solving
- Effective communication
- Creative thinking
Areas of business analysis:
- Business developer – To identify the customer needs and offering business opportunity
- Business model analysis – To define marketing analysis approach and business policies of the organisation
- Process design – Workflow standardization in an organisation
- System analysis – Identify the requirement of technical systems
Business analyst can be act as a middle man between stakeholders, data analyst and management executives to understand the reasoning.
Business analyst parts can be additionally separated into different job titles: Financial analyst, operations research analyst, market research analyst so on.
Marketing analyst:
Marketing analytics is used to get the return on investment (ROI) of marketing efforts and identified opportunities for improvement by studying metric data as well as from measuring and managing the data.
Financial analyst:
It is used to analyse a present economy of market, industry, project for to take a better decision in business models and its results easy to understood the reports
Eg: Investment, purchase and sales.
Difference between marketing, Business analyst?
| S.no | Business analyst | Marketing analyst |
| 1 | Business analyst not required a effective communication skills compared to marketing skills. But they have to act as translator between stakeholder and data analyst | Marketing analyst needed communication skills |
| 2 | Business analysts need to think of reorganization entire business procedures from a stakeholder’s viewpoint. | marketing analysts need to understand numbers in the context of refining marketing strategies |
| 3 | “bottom-line” metrics and KPIs | metrics indicative of successful marketing strategies and campaigns |
| 4 | Helps to take business decision in organisation & make more effective | Whereas marketing analyst handling the marketing part alone. Also one of the part of entire business. |
Necessities, proven working experience as Data analyst or Business analyst
- Technical skill with respect to information models, database plan improvement, information mining, and division strategies
- Strong information on and involvement in revealing bundles (Business Objects and so on), databases (SQL and so forth), programming (XML, JavaScript, or ETL structures)
- Knowledge of insights and experience utilizing factual bundles for examining datasets (Excel, SPSS, SAS and so forth)
- Strong expository aptitudes with the capacity to gather, arrange, investigate, and disperse huge measures of data with meticulousness and precision
- Adept at questions, report composing and introducing discoveries
- BS in Information Management or Statistics, Mathematics, Economics, Computer Science, etc.,
Data analyst:

A Data Analyst deciphers information and transforms it into data that can offer approaches to improve a business, in this way influencing business choices.
Information Analysts accumulate data from different sources and decipher examples and patterns – as such a Data Analyst set of working responsibilities should feature the explanatory idea of the job.
When information has been assembled and deciphered, the Data Analyst will report back what has been found in a far-reaching study to the more extensive business/significant partners.
Key Reasons to Become a Data Analyst:
1. Profoundly popular field
2. Generously compensated and Diverse Roles
3. Advancing working environment situations
4. Improving item guidelines
5. Helping the world
Information expert calling is the most requested in 2020. It will increment furthermore and most top organizations are recruiting like Amazon, Facebook, Google, Intel, and Apple, and so forth. One of the quickest developing areas and furthermore high paid occupations contributions.
It explains dreary errands what human sets aside on more effort to take on basic reasoning and critical thinking aptitudes.
The use of AI has empowered organizations to tweak their contributions and upgrade client encounters.
Prescient examination and AI have upset the medicinal services industry. Information science is sparing lives by empowering early discovery of tumors, organ inconsistencies, and then some.
1. What is the difference between a Data Analyst and a Business Analyst?
| Sl.no | Data Analyst | Business Analyst |
| 1. | Data analyst more with processing data and drawing conclusions rather than implementing changes and communicating results | Business analyst more with implementing changes and communicating results rather than processing data and drawing conclusions |
| 2. | Need more problem-solving skills and data analysis skills, understating of program. | It requires more of decision-making and data visualization skills |
| 3. | It is more of an operational role in the organization. | It is more of a strategic role in the organization. |
| 4. | It requires knowledge of statistics, SQL, data mining, etc. | Knowledge of Business Intelligence, Data Warehousing, Analytics, etc. is required for this role. |
| 5 | They can work independently | They work direct with different roles and department |
Analyst Salary in India
For information expert in India,
New data expert (1 to 4 years) of experience –4lakhs/annum
Mid carrier expert (5 to 9 years) of experience –6 to 7lakhs/annum
Senior or developed bearer information examination (5 to 9 years) of experience- >10lakhs/annum
The following are the best analytics Interview Questions and Answers.
Analyst questions are segregated with 3 different parts:
- Business analyst
- Financial analyst
- Marketing & data analyst

Top 25 Business analyst related interview questions:
- How do you perform risk management in your project?
- Differentiate between a project life cycle (PLC) and software development life cycle (SDLC)
- How will you define a good quality requirement as a business analyst?
- What steps are included in developing a product from a basic idea?
- What are all the analytical techniques are available to examine the complex relationship between variables?
- Distinguish between decision trees, clustering, and linear regression?
- Tell one industrial application for business analytical?
- Please list the tools that are helpful for business analysis?
- Explain Pareto Analysis?
- Define R?
- What is the necessity elicitation technique?
- Mention some fundamental differences between a requirement and need from a company analysis perspective?
- What are non-functional requirements and how will you capture them?
- Which documents are used to capture non-functional requirements?
- What is the alternate flow in the use case diagram?
- What is the Agile Manifesto?
- When should you use the Waterfall model instead of Scrum?
- What are the four key phases of business development?
- Explain the term ‘increment’?
- What are the different types of agile methodologies?
- What is business process modeling?
- List the advantages of business process modeling.
- How do you analyze performance metrics?
- Explain the purpose of the requirement traceability matrix?
- What do you think is the scope of Business Analysts in the agile methodology perspective?
Top 25 Financial analyst related interview questions:
- What is ‘capital structure ‘?
- What is ‘goodwill ‘?
- Discuss the Financial Statements of a company and what do they tell about a company?
- What Are The Various Systems Of Accounting? Explain Them.
- What’re the several types of expenditures considered for the desire to of accounting?
- What are the major advantages and disadvantages of proprietary firms?
- What is EBITDA?
- Cite the most effective three headlines you remember reading in the WSJ or seeing on Bloomberg Channel or CNBC this year.
- With the order do praise, financial advancement, and private accomplishment drive you?
- You most likely have thought about being a businessman?
- Can u tell me about working capital?
Top 50 Data analyst and marketing analyst related interview questions:
- Mention what is data cleansing?
- Mention what are the various steps in an analytics project?
- Difference between Data Analyst vs. Data Scientist
- Mention what is the responsibility of a Data analyst?
- What is required to become a data analyst?
- List of some best tools that can be useful for data analysis?
- Why do you want to be a data analyst?
- Where do you see yourself in a decade?
- For what reason would you like to be an information investigator?
- Describe a time when you had to persuade others. How did you get buy-in?
- How do you feel about data?
- Can you add 1-100 together right now?
- List some common problems faced by data analysts?
- What is the difference between data mining and data profiling? (Maestro Technologies)
- How have you dealt with messy data in the past? (Two Sigma)
- How many X is in Y place?
- You have 10 boxes of cigarettes with 10 cigarettes in each bag. All but one bag has marbles
- What would be your top interview question for prospective data analysts? How would you answer this question?
- Describe the process of data analysis?
- What are the major differences between data mining and data analysis?
- Mention the important steps in the data validation process?
- What are the different types of Hypothesis Testing?
- Mention the key skills required for Data Analyst.
- Describe univariate, bivariate, and multivariate analysis.
- What is the difference between linear and logistic regression?
- Explain the time series analysis?
Marketing research analyst questions
- What are the types of market research?
- How is the research classified on the basis of the type of data required?
- Which study would you wish – Primary or Secondary?
- What are the various research tools used for Primary Research?
- What are the sources of secondary research?
- Why do we do market research?
- What are the two most important factors that decide the scope of market research?
- Discuss the steps to transport out market research.
- What are the normal mistakes you ought to avoid while preparing your survey questions?
- Name some standard and widely used statistical data analysis approaches for market analysis.
- As a Market Research Analyst, what’ll you do to get more information from your own team members out of the daily process of interaction?
- What are the main element responsibilities of a market research executive?
- What are the main element skills required to become a successful market research analyst?
- Does your candidate choose to get a lot of space to complete their particular work, or do they prefer a more hands-on style with a lot of direction?
- What Is Marketing Research?
- Why Is Marketing Research Important?
- What Is A News Article?
- What Is Photo Editing?
- in what way Can You Use Word-of-mouth As a Marketing Tool?
- How Do I Identify I Am Success My Target Audience?
- What Features Should Be Measured When Choosing A Media Vehicle?
- What Is More Important: Reach Or Frequency?
- How Can We Learn More About, Target Audience?
- How Can We Evaluate The Effectiveness Of Advertising?
Top 25 Business analyst related interview questions:
1. How do you perform risk management in your project?
Here are 3 steps to performing effective risk analysis
- Consider Your Organization’s Attitude towards Risks
- Assess Risks
- identify a Risk Response Strategy
Step One: Consider Your Organization’s Attitude towards Risks
Establishments admit different levels of risk depending on their risk attitude. The danger tolerance, appetite, and threshold of the corporation and its stakeholders should be fully understood, defined, and communicated.
An organization might be risk-averse, risk-neutral, or risk-seeking. A risk-averse organization seeks to reduce risk around possible and gravitates towards attaining an advanced level of certainty on its projects.
For risk-neutral organizations, the advantages of the danger response should be corresponding to or outweigh the costs. Risk-seekers on the other hand, accept low odds of success so long as the advantages of success are considerably high.
Step Two: Assess Risks
Once risks have now been identified by the team, a risk assessment must certainly be carried out in a collaborative setting where team members can gather to ascertain the probability (what may be the likelihood that the danger will happen?) and the impact (what degree of damage, costs or benefits will undoubtedly be incurred, should the danger happen?) of the risks. This provides a way of prioritizing risks to ascertain that ought to be addressed and in what order. .
Step Three: identify a Risk Response Strategy
The entire exercise of risk analysis culminates in the identification of a strategy that may enable the corporation to respond to risks accordingly, instead to be caught by surprise.
For negative risks, there are 4 ways by which an organization may decide to respond:
Transfer: The responsibilities of bearing the danger are transferred to another entity, usually in the shape of insurance.
Avoidance: The organization does all it could to ensure the danger does not occur.
Mitigation: The organization reduces the odds of the danger occurring and also identifies alternatives for reducing the consequences.
Acceptance: When there’s no way to avoid, transfer or mitigate risk, the corporation accepts that there is nothing that can be achieved and makes no effort to deal with it.
For positive risks (opportunities), there are 4 other ways by which an organization can respond: Acceptance: The organization chooses to simply accept the ability once it lands.
Exploit: The organization actively takes steps to ensure the ability materializes.
Enhance: Here is the exact opposite of mitigating. The organization takes steps to increase the probability of the opportunity occurring and its associated benefits, should it occur.
Share: Involves working together with another entity to increase the probability of the ability occurring and sharing the benefits.
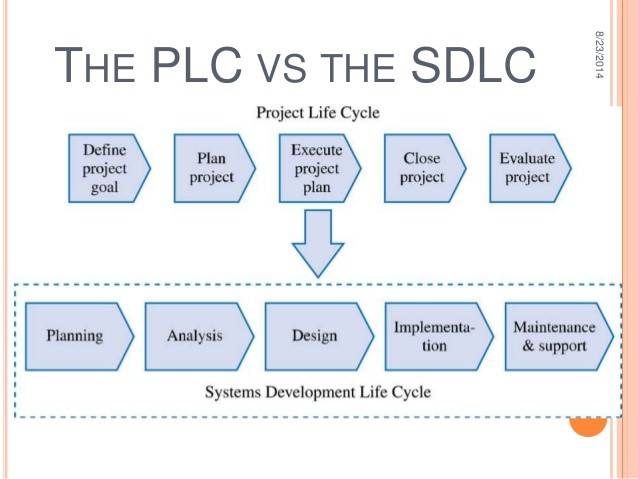
1. Differentiate between a project life cycle (PLC) and software development life cycle (SDLC)
| S.no | Project life cycle (PLC) | Software development life cycle (SDLC) |
| 1. | PDLC Phases are Idea generation and screening Research Development Testing Analysis Introduction | SDLC Phases are Requirements gathering or analysing user requirementsDesigning the program Coding the program Documentation and testing of the system Operation and maintenance of the system |
| 2. | PDLC is taking care of the entire project. | SDLC is a subset of PDLC. Such steps are the responsibility of a technical department within an organization. |
| 3. | PDLC is defined as a process that is responsible for bringing to market a new product and generally includes the business units. | SDLC on the other hand, is used for developing particular software products. |
| 4. | PLC phases include Idea generation, screening, research, development, testing, and analysis | SDLC phases include requirement gathering, design, coding, documentation, operations, and maintenance |
| 5. | Used for developing a new product in the business | Used for developing particular software products |
| 6. | There are 4 stages in PDLC IntroductionGrowthMaturityDecline | The six most common SDLC methodologies are Agile. The Agile model has been around for about a decade. … Lean. The Lean model for software development is inspired by lean manufacturing practices and principles. Waterfall Iterative Spiral DevOps. |
2. How will you define a good quality requirement as a business analyst?
Each Goal should have a Weightage and need to be SMART (Specific, Measurable, Achievable, Relevant, and Time bound)
- Specific (simple, sensible, significant).
- Measurable (meaningful, motivating).
- Achievable (agreed, attainable).
- Relevant (reasonable, realistic and resourced, results-based).
- Time bound (time-based, time limited, time/cost limited, timely, time-sensitive).
- Specific
Your goal should be clear and specific, otherwise you won’t be able to focus your efforts or feel truly motivated to achieve it. When drafting your goal, try to answer the five “W” questions:
- What do I want to accomplish?
- Why is this goal important?
- Who is involved?
- Where is it located?
- Which resources or limits are involved?
Example
Imagine that you are currently a marketing executive, and you’d like to become head of marketing. A precise goal could be, “I need to improvement the skills and experience necessary to become head of marketing inside my association, so that I can build my career and lead a successful team.”
2. Measurable
It’s important to have measurable goals, so that you can track your progress and stay motivated. Assessing progress helps you to stay focused, meet your deadlines, and feel the excitement of getting closer to achieving your goal.
A quantifiable goal should address questions such as:
- How much?
- How many?
- when it is accomplished?
Example
You may measure your goal of obtaining the skills to become head of marketing by determining that you will have finished the essential training courses and gained the pertinent experience within five years’ time.
3. Achievable
Your goal mouth also needs to be accurate and possible to be successful. In other words, it should stretch your skills but still continue conceivable. When you set an achievable goal, you may be able to identify formerly overlooked chances or resources that can bring you closer to it.
An achievable goal will usually answer questions such as:
- How can I accomplish this goal?
- How accurate is the goal, based on other limits, such as financial factors?
Example
You may need to enquire whether emerging the skills essential to becoming head of marketing is realistic, based on your present experience and qualifications. For example, do you have the time to far-reaching the required training successfully? Are the necessary resources accessible to you? Can you afford to do it?
4. Relevant
This step is about confirming that your goal matters to you, and that it also bring into line with other applicable goals. We all need provision and support in achieving our goals, but it’s important to recollect control over them. So, make sure that your tactics drive everybody forward, but that you’re still responsible for achieving your own goal.
A applicable goal can answer “yes” to these questions:
- Does this seem worthwhile?
- Is this the correct time?
- Does this match our other efforts/needs?
- Am I the right person to reach this goal?
Is it applicable in the current socio-economic environment?
Example
You might want to gain the skills to become head of marketing within your organization, but is it the right time to undertake the required training, or work toward additional qualifications? Are you sure that you’re the right person for the head of marketing role?
Have you considered your spouse’s goals?
For example, if you want to start a family, would completing training in your free time make this more difficult?
5. Time-bound
Every goal needs a target date, so that you have a deadline to focus on and something to work toward. This part of the SMART goal criteria helps to prevent everyday tasks from taking priority over your longer-term goals.
A time-bound goal will usually answer these questions:
- What can I do six months from now?
- When?
- What can I do today?
3. What steps are a part of having a product from a fundamental idea?
Answer:
- Market Analysis: This can be a business plan through which the characteristics of a market having already been studied, like how industry changes and behaves dynamically.
- SWOT Analysis: This can be a process through which the Strengths, Weaknesses, Opportunities, and Threats of an organization are identified.
- Personas: They’re typical users of websites or intranet who represents the goals and characteristics of various large groups of users. Personas replicate the true users in functional design.
- Competitor Analysis: Evaluation of the strengths and weaknesses of outside competitors.
- Strategic Vision and Feature set: The method of developing the goals in present and planning to accomplish the same in the future by moving towards the vision.
- Prioritize Features: Most of the top features of the merchandise that is usually to be developed are prioritized by the merchandise management to greatly help the development team.
In addition to the above-mentioned steps, you will find furthermore terms involved in the process of having a product. They are Use case, SDLC, Storyboards, Test Cases, Monitoring, and Scalability.
4. What are all the analytical techniques are available to examine complex relationship between variables?
Analytical techniques permit researchers to observe complex relationships between variables. You can find three basic forms of analytical techniques:
- Regression Analysis
- Grouping Methods
- Multiple Equation Models
Regression Analysis
Regression analysis assumes that the dependent, or outcome, variable is directly suffering from more than one independent variables. You can find four important forms of regression analyses:
Ordinary least squares (OLS) regression
- Used to determine the partnership between a dependent variable and more than one independent variables
- Used once the dependent variable is continuous. For instance, if the dependent variable was family child care expenses, measured in dollars, OLS regression would be used
Logistic regression
Used once the dependent variable is dichotomous or has only two potential outcomes. For instance, logistic regression would be used to examine whether a household uses child care subsidies
Visit the following websites to learn more about OLS and logistic regression:
- Report on Regression Techniques
- The Little Handbook of Statistical Practice
Hierarchical linear modeling
- Used when data are nested. Nested data occur when several individuals owned by exactly the same group under study. For instance, in child care research, many students are cared for by exactly the same child care provider and many child care providers work within exactly the same state. The youngsters are nested in the kid care provider and the kid care provider is nested in their state
- Allows researchers to determine the results of characteristics for each level of nested data, child care providers and states, on the outcome variables
Duration models:
It is used to estimation the length of a status or process. For instance, in child care policy research, duration models have now been used to estimate the length of time that families receive child care subsidies.
Grouping Methods
Grouping methods are processes for classifying observations into meaningful categories.
One grouping method, the discriminant analysis and identifies characteristics that distinguish between groups. For Eg., one investigator would use discriminant examination to determine which characteristics identify families that seek child care subsidies and which identify families that not.
Report on Discriminant Function Analysis
The next grouping method, cluster analysis, can be used to classify similar individuals together. Like, cluster analysis will be used to group together families who hold similar views of child care.
Report on Cluster Analysis
Glossary terms related to grouping methods:
Cluster Analysis
Discriminant Analysis
Exploratory Study
Interagency Meeting on Subgroup Analysis
This meeting predicated on innovative methods for conducting subgroup analysis and discussions of guidelines for interpretation and reporting of subgroup analyses in prevention and intervention research.
Multiple Equation Models
Multiple equation modeling, which will be often an expansion of regression, can be used to examine the causal pathways from independent variables to the dependent variable. You can find two main types of multiple equation models:
- Path analysis
- Structural equation modeling
- Path analysis
It allows researchers to examine multiple direct and indirect factors behind a dependent, or outcome, variable.
A path diagram is performed that identifies the routes between the independent and dependent variables
The paths can run directly from an unbiased variable to a dependent variable, or they could run indirectly from an unbiased variable, via an intermediary variable, to the dependent variable
The entire model is tested to ascertain the relative significance of each causal pathway
Structural equation modeling
Expands path analysis by enabling multiple indicators of unobserved (or latent) variables in the model.
5. Distinguish between decision trees, clustering, and linear regression?
The three important algorithms: decision trees, clustering, and linear regression. They’re extensively used and readily accepted for enterprise implementations.
We can distinguish and summarize these three algorithms the following:
When we don’t find out about the info and want to group data points to understand their collective behavior, clustering is among several go-to methods.
If you want to predict numbers before they occur, then regression methods are used. Linear regression is among several regression methods, and among several algorithms used first by most machine learning professionals.
If you discover a need certainly to classify objects or categories based on their historical classifications and attributes, then classification methods like decision trees are used.
Note: Decision trees can be properly used for regression, as well.
Let’s dive only a little deeper.
Clustering Algorithms (Unsupervised Learning)
Clustering techniques can group attributes into some similar segments where data within each group resemble each other and distinctive across groups. It is surely an unsupervised learning process finding logical relationships and patterns from the structure of the data. It may be utilized for cases that involve:
Discovering the underlying rules that collectively define a lot (i.e. topic generation)
Partitioning (i.e. customer segmentation or market segmentation)
Discovering the inner structure of the info (i.e. gene clustering)
Decision Trees (Supervised Learning: Classification)
Decision trees are popular classifiers in enterprises/industries for their transparency on describing the principles that create a classification/prediction. They’re arranged in a hierarchical tree-like structure and are simple to understand and interpret. They’re not susceptible to outliers. Decision trees may be well-suited for cases by which we truly need the capability to explain the reason behind a particular decision. Like, sales and marketing departments might need a complete description of rules that influence the acquisition of an individual before they start their campaign activities.
Linear Regression (Supervised Learning: Regression)
Linear regression could function as the oldest and most-used regression analysis. It’s studied rigorously and used extensively in practical applications. Linear regression is surely an approach for deriving the partnership between a dependent variable (Y) and numerous independent/exploratory variables (X). With linear regression, this relationship may be used to predict a confirmed as yet not known Y from known Xs.
Linear regression has many functional use cases, but most applications come under among several following two broad categories:
If the goal is a prediction or forecasting, it could be utilized to implement a predictive model to an observed data number of dependent (Y) and independent (X) values.
Linear regression analysis may be placed on quantifying the change in Y for a confirmed value of X that assists in determining the potency of the partnership between dependent (Y) and independent (X) values.
6. Tell one industrial application for business analytical?
Coca-Cola Bottling Company maximized operational efficiency
Company: Coca-Cola Bottling Company (CCBC), Coca Cola’s largest independent bottling partner
Problem: Manual reporting processes restricted usage of real-time sales and operations data.
Solution: Coca-Cola’s business intelligence team handles reporting for several sales and delivery operations at the company. Using their BI platform, the team automated manual reporting processes, saving over 260 hours a year—significantly more than six 40-hour workweeks.
Report automation and other enterprise system integrations put customer relationship management (CRM) data back to the hands of sales teams in the field through mobile dashboards that provide timely, actionable information and a definite competitive advantage.
A self-service BI execution fosters more effective collaborations between IT and business users that maximize the expertise of participants. Analysts and IT can focus on big-picture strategy and long-term innovations such as enterprise data governance as opposed to manual research and reporting tasks.
7. Please list the tools that are helpful for business analysis?
Answer:
The following tools are helpful for business analytics:
- Rational tools,
- Microsoft Excel,
- Microsoft Word,
- PowerPoint,
- MS Project,
- ERP systems.
8. Explain Pareto Analysis?
Answer: Pareto Analysis is an appropriate method used in decision-making for quality control activities and also used in outlining out the resolutions for defects. It is characterized as a decision-making technique based on its statistics that, with a limited number of selected inputs we can have a great impact on the outcome.
It is also stated as 80/20 rule because the idea that by doing 20% of the work you can generate 80% of the advantage of doing the complete job
9. Define R?
Answer: R is a language and environment for statistical calculating and graphics. It is a GNU project which is related to the S language and environment which was established at Bell Laboratories can be considered as a different execution of S. There are some vital differences, but much code written for S runs unchanged under R.
10. What is the necessity elicitation technique?
Answer: Requirement elicitation is the process of requirement gathering from stakeholders, users, and customers by conducting meetings, questionnaires, interviews, brainstorming prototyping, sessions, etc.
11. Indicate the fundamental difference between a requirement and need in a company analysis perspective?
Answer: Needs are high-level definitions of the future goals of a business. Whereas, Requirements would be the representation of the detailed description of this business needs.
12. What are non-functional requirements and how will you capture them?
Answer: Non-functional requirements represent the performance level characteristics like how quickly it can respond, how smooth is an individual interface, security, etc. of the applying under development (AUD). No functional requirements are captured in the SRS document in its designated section.
13. Which documents are used to capture non-functional requirements?
Answer: There are two documents that are used to capture non-functional requirements, and they are:
- SDD (System Design Document)
- FRD (Functional Requirement Document)
15. What is alternate flow in use case diagram?
Answer: It is an alternative solution or activity in a use case that should be followed in case of any failure in the system.
16. What is the Agile Manifesto?
Answer: Agile Manifesto is a software guide about the agile development principles which ensure iterative solutions.
17. When should you use Waterfall model instead of Scrum?
Answer: If the requirement is simple and specific, we should go for Waterfall model instead of Scrum.
18. What are the four key phases of business development?
Answer: The four key phases of business development:
- Forming
- Storming
- Norming
- Performing
19. Explain the term ‘increment’?
Answer: Increment refers to the sum of all of the product backlog items completed in a sprint. The new increment value also includes the increment of the previous sprints.
20. What are the different types of Agile methodologies?
Answer: A few of the well-known agile methodologies are:
- Scrum
- Lean software development and Extreme Programming (XP)
- Feature-driven development (FDD)
- Crystal Methodology
- DSDM (Dynamic Software Development Method)
21. What is the purpose of the Requirement Traceability Matrix?
Answer: Requirement Traceability Matrix (RTM) is used to record all the requirements given by a client, so the purpose of RTM is to ensure that every one of the mentioned requirements are met.
22. What is business process modeling?
Business process modeling is an integral part of business process management, which is used to improve the business process. It is the representation of an organization’s business process.
23. List the advantages of business process modeling.
1. It is used to picture a clear understanding of the business processes.
2. It provides consistency and control over the processes of the project.
3. It is used to identify and eliminate errors and bottlenecks.
4. It gives a pathway for clear start and end for the process without hassles.
24. How do you analyze performance metrics?
1. Be sure that your key deliverables are met.
2. The budget and time for the project shouldn’t be extended.
3. Quality deliverables are maintained.
25. What do you think is the scope of Business Analysts in the Agile methodology perspective?
With Agile methodology, Business Analysts behave as a connection between the development team and stakeholders. They act on key deliverables to prioritize and deliver the project in the stipulated time and budget.
TOP 25 MARKETING ANALYSIS INTERVIEW QUESTION
1. Explain ‘financial modeling ‘?
Ans. Financial modeling is really a quantitative analysis commonly ideal for either asset pricing or general corporate finance.
2. Discuss about a ‘cash flow statement.’
Ans. You’ll need to be well-prepared because of this question. Focus on the web income and go line by line explaining all major adjustments to attain cash flow from operating activities. Mention all the required parts which can be associated with it.
3. Is it conceivable for a company to have positive cash flow but then still be in serious financial trouble?
Ans. Yes. You can find two examples –
(i) a small business that’s selling off inventory but delaying payables will show positive cash flow for a while though it is in trouble.
(ii) An organization has strong revenues for the full-time scale but future forecasts demonstrate that revenues will decline.
4. What do you think is the best assessment metric for examining a company’s stock?
Ans. There’s no specific metric. This will depend how you place the perfect solution is and make the interviewers understand value with this metric that you mention.
5. What is ‘working capital ‘?
Ans. Working capital is the foremost defined as current assets minus current liabilities.
6. Explain quarterly forecasting and expense models?
Ans. The analysis of expenses and revenue that’s predicted to be produced or incurred in the future is called quarterly forecasting.
An expenditure model tells what expense categories are allowable on a specific type of work order.
7. What is the variations among a journal and a ledger?
Ans. The journal is useful information where all of the financial transactions are recorded for the first time. The ledger is the one that has particular accounts obtained from the first journal.
8. Mention one variance among a P&L statement and a balance sheet?
Ans. The balance sheet summarizes the financial position of a small business for a particular point in time. The P&L (profit and loss) statement shows revenues and expenses during a collection degree of time.
9. What is ‘cost accountancy ‘?
Ans. Cost accountancy is the application form kind of costing and cost accounting principles, approaches, and methods to the science, art, and practice of cost control and the ascertainment of profitability combined with the presentation of information for the goal of managerial decision making.
10. What is NPV? Where is it used?
Ans. Net Present Value (NPV) could be the difference between today’s value of cash inflows and today’s value of cash outflows. NPV is within capital budgeting to analyses the profitability of a projected investment or project.
11. How many financial statements are there? Name them
Ans. You can find four main financial statements – 1) balance sheets, 2) income statements, 3) cash flow statements and 4) statements of shareholders ‘equity.
12. What are ‘adjustment entries ‘?
Ans. Adjustment entries are accounting journal entries that convert to the accrual basis of accounting from a company’s accounting records.
13. Do you follow the stock market? Which stocks in particular?
Ans. You ought to be careful in answering this question. As an economic analyst, following a share market proves to be beneficial. Also, often be up-to-date with the stocks.
14. What is meant by a ‘composite cost of capital ‘?
Ans. Also known as the weighted average cost of capital (WACC), a composite cost of capital is really a company’s cost to borrow money given the proportional levels of each type of debt and equity a small business has brought on.
WACC= Wp (cost of pf. Stock) + Ws (cost of stock/RE) + Wd (cost of debt)
15. What is ‘capital structure ‘?
Ans. The capital structure is what sort of company finances its overall operations and growth by utilizing different sourced elements of funds.
16. What is ‘goodwill ‘?
Ans. Goodwill is a property that captures excess of the cost over the fair market value of an acquired business.
The above-mentioned questions and answers will allow you to in your preparation for another interview for a situation of a financial analyst. It’ll offer you an idea of the sort of questions which can be generally asked. However, you will have to anticipate answering all kinds of questions — technical skills, interpersonal, leadership or methodology.
17. Discuss the Financial Statements of a company and what do they tell about a company?
Ans. Financial Statements of a company are statements, in which the organization keeps a proper record of the company’s position and performance over time.
The objective of Financial Statements is to provide financial information about the reporting entity that’s beneficial to exist and potential investors, creditors, and lenders for making decisions about whether to invest, give credit, or not. You will find mainly three types of financial statements which a company prepares.
1. Income Statement – Income Statement tells us about the performance of the organization over a particular account period. Financial performance is represented in terms of expenses and revenue generated through operating and non-operating activities.
2. Balance Sheet – Balance Sheet tells us about the career of the organization at a particular point in time. Balance Sheet contains Assets, Liabilities, and Owner’s Equity. The basic equation of Balance Sheet: Assets = Liabilities + Owner’s Equity.
3. Cash Flow Statement – Cash Flow Statement tells us the amount of money inflow and outflow. Cash Flow Statement tells us how the cash contained in the balance sheet changed from a year ago to the existing year.
18. What Are The Various Systems Of Accounting? Explain Them.
Answer:
There are two systems of Accounting:
1. Cash System of Accounting: This method records only cash receipts and payments. This method assumes you will find no credit transactions. In this technique of accounting, expenses are believed one time they’re paid and incomes are believed when they’re actually received.
This method is utilized by the organizations which are established for a non-profit purpose. But this technique is regarded as being defective in nature as it generally doesn’t show these profits earned and the current state of affairs of the organization.
- Mercantile or Accrual System of Accounting: In this technique, expenses and incomes are believed through that period to that specific they pertain.
- This method of accounting is regarded as being ideal but it might result into unrealized profits that might reflect in the books of the accounts on that the corporation must cover taxes too. All the organization types of organizations are legally required to look at alongside the Mercantile or Accrual System of Accounting.
19. What’re the several types of expenditures considered for the desire to of accounting?
For the accounting purpose expenditures are classified into three types:
Capital Expenditure is surely an amount incurred for acquiring future assets such as for example land, building, equipment that is continually employed for the desire to of earning revenue and not made for sale.
These costs are documented in accounts namely Property, Plant, Equipment. The benefits of such expenditure are spread over several accounting years.
Example: Interest on capital paid, Expenditure on the purchase or installing of a residence, brokerage, and commission paid.
Revenue Expenditure could be the expenditure incurred within an accounting year and the advantages of which might be also enjoyed in an identical period only. This expenditure doesn’t improve the earning capacity of the business enterprise but maintains today’s earning capacity of the business. It included most of the expenses which are incurred during the daily running of the business. The advantages of this expenditure are for a quick period and aren’t forwarded to some other location year. This expenditure is on recurring nature.
Example: Buying of raw material, selling and distribution expenditures, Salaries, wages, etc.
Deferred Revenue Expenditure is a revenue expenditure which includes been incurred during an accounting year but the key advantageous asset of which might be extended a number of years. And they’re charged to profit and loss account.
Example: Development expenditure, Advertisement, etc.
20. What are the major advantages and disadvantages of proprietary firms?
Options that come with proprietary firms:
1. Easy Formation: Proprietary firm is the easiest and economic form to generate and operate as it could certainly be started by any person minus the legal formalities. Also, there’s no set limit of minimum or maximum quantity of persons to begin the business enterprise as it could certainly be started by way of a single person.
3. Quick Decision Making: Being the only real owner of the business enterprise the only real trader takes all of the decisions himself. He evaluates all of the opportunities available and finds a definite answer to problems making decision making quick.
4. Flexibility in Operations: One man ownership afford them the ability to bring flexibility in the operations of the business.
5. Personal give attention to customer needs: As a result of the little geographical area, it becomes easy for the only real proprietor to deal with all its customers personally and knows their needs. Thus it generates easy for him to pay special give attention to consumer needs.
6. Creation of Employment: The proprietor firm facilitates self-employment and also employment for a lot of others. It promotes entrepreneurial skills one of the individuals.
7. Equal Distribution of Wealth: Proprietary firm is generally a little scale business. Hence there are many opportunities for individuals to begin their particular business enabling widespread dispersion of economic wealth.
8. No Legal Formalities required: An amazing firm isn’t necessary to comply with all the legal and procedural formality.
Disadvantages of Proprietary Firms
1. Unlimited Liability: In such firms, the liability of a canine owner is unlimited as a canine owner takes more risk to earn more profits and increase the total amount of his business by supplying his personal assets.
2. Limited Financial Resources: Being the single owner of the business enterprise, the availability of funds from various sources is limited.
3. No Legal Status: The existence of business is a result of the existence of sole proprietor. Death or insolvency of the only real proprietor brings a summary to the business.
4. Limited Capacity of Individual: Someone has restricted knowledge, few skills as a result of which his capacity to undertake responsibilities, his capacity to take quick decisions, and bear risks are often restricted.
5. transferring of business is difficult in the case of a Proprietary Firm.
- Higher Taxes: As the only real proprietor is the direct person enjoying the earnings thus he needs to pay higher taxes.
21. What is EBITDA?
“EBITDA means Earnings earlier Interest, Taxes, Depreciation, and Amortization”.
In the world of finance and investments, EBITDA is highly important, rendering it individual that’s now far more than oftentimes be discussed in an interview. Speaking clearly to the thought demonstrates you’re solidly grounded in key financial principles.
22. Cite the most effective three headlines you remember reading in the WSJ or seeing on Bloomberg Channel or CNBC this year.
Industry knowledge is simply a benchmark of professional excellence. If you are not up-to-date within your field, in which case you won’t engage in any job applicant shortlist. Finance leaders must be proficient in emerging market trends, corporate movements, new regulations, as well as other notable developments in the sector to enable these phones to detect risks and opportunities and produce smart proactive decisions due to their organizations. You merely will not get elevated to leadership roles in case you simply confine your employment and then whatever task is associated with you. Your awareness should well extend far in the cubicle and immediate functions.
(Note: Without doubt, a money pro should be familiar using what WSJ represents — The Wall Street Journal.)
Keep up-to-date with this:
Relevant local, federal, and international policies affecting your business
New technologies, tools, and innovation which might be changing how a niche conducts business
Major market disruptions attributable to corporate scandals, the entry of newest players, mergers or acquisitions, IPOs, and radical adjustments in supply and demand.
23. With the order do praise, financial advancement, and private accomplishment drive you?
This featured prominently in the episode of “The Job Interview Show” from CNBC. To begin with hearing, the question seems safe enough for a lot of leeway for opinionated responses yet it will be the source — the cofounder of accounting firm Xendoo (Lillian Roberts) — claimed it is capable of doing possess the right answer. She said this trick question generally is an arrangement breaker that reveals applicant score values and hierarchy of motivation. The precise order has to be 1) personal accomplishment; 2) financial advancement; and 3) praise.
Avoid making the impression that producing savings will be the overarching motivation, which generally is really a red rag for a few recruiters. Instead, always select accomplishment. Stating that you’re motivated by great work, excellence, good success, and pride at this which you are doing reveal that you are perfect employee-driven by an excellent work ethic. Last available has to be “praise.” Roberts said you will not ever always receive recognition finest items you might be doing. That, unfortunately, maybe the real world. Instead, being sufficiently driven by personal pride and satisfaction should be a core attribute.
24. You most likely have thought about being a businessman?
Steer on this question. Being innovative, creative, resourceful, and results-oriented are good traits over the board. However, these seem to be closely related to entrepreneurship within the years. In job interviews, advertising to qualify that you have one or greater amount of these traits and you rather utilize them plus a better organization, you’re going to be proud of. Mention that choice to seeing yourself being a businessman, report that you’re more associated with an “entrepreneur,” which is the term for highly creative and innovative individuals positively transforming the organizations that employ them.
For folks who report that you’re entrepreneurial and are generally planning to create your own personal company, then that may signal either an unwanted advanced level of independence or perhaps an unclear path to the firm to recoup its on boarding and training investments on you.
In the event you have prior experience at owning your own business or earning money being a completely independent contractor, turn the tables around by saying you’ve already experienced escaping a business environment or maybe your team and that almost all for you. Statement that you miss the highly particular functions of a finance professional.
25. What is working capital?
Working capital is frequently thought of as current assets less current liabilities. It shows what type of money remains turned into items just like inventories and receivables and the quantity of it will be important to be in short-term obligations for the year.
Top 50 Data analyst and marketing analyst questions
1. What are some basic information expert obligations?
We enrolled a few specialists to assist you with getting a sneak look at the day by day obligations of a run of the mill information investigator.
1. Delivering reports
2. Spotting designs
3. Teaming up with others
4. Gathering information and setting up a framework
2. What is information cleaning?
Information cleaning likewise alluded as information purging, manages to distinguish and expelling blunders and irregularities from information so as to upgrade the nature of the information.
3. Notice what are the different strides in an investigation venture?
Different strides in an examination venture incorporate
- Problem definition
- Data investigation
- Data planning
- Modelling
- Validation of information
- Implementation and following
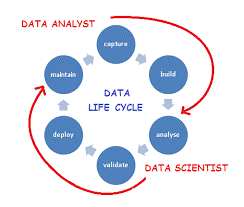
4. The distinction between Data Analyst versus Information Scientist
In view of all that, you may be pondering about another conspicuous information job—the information researcher. While it’s sheltered to expect there is some cover in the sort of work they do, there are huge contrasts between information experts and information researchers.
Since the job of an information researcher is generally new and some of the time muddled, those in the field have attempted to characterize and separate it from that of the information examiner. We should separate it dependent on abilities and employment obligations.
Data analysts:
- Have moderate math and factual abilities
- Have moderate software engineering/coding abilities
- Develop key execution pointers
- Have a solid business sharpness
- Create representations of the information
- Utilize business insight and investigation apparatuses
Data Scientist:
- Have solid math and factual abilities
- Have solid software engineering/coding abilities
- Identify patterns with AI
- Write code to aid information examination
- Have a solid business intuition
- Make forecasts dependent on information patterns
Despite the fact that information experts and information researchers have various foundations and qualities, remember that these jobs can be somewhat soft by the way they’re characterized. This implies duties may change contingent upon the association.
Sorts of information investigation
At its center, information examination is tied in with addressing questions and deciding. What’s more, similarly as there are various sorts of inquiries, there are likewise various kinds of information investigation relying upon what you’re planning to achieve. While there’s no unchangeable glossary of these kinds of information investigation, the people at Science Soft work superbly separating this work into four essential territories:
- Descriptive investigation answers, “What occurred?”
- Analytic investigation answers, “For what reason proficient something happens?”
- Predictive examination answers, “What is probably going to occur?”
- Prescriptive investigation answers, “What move ought to be made?”
Information examiners can tailor their work and answer to fit the situation. For example, if a maker is tormented with delays and impromptu stoppages, a demonstrative examination approach could help recognize what precisely is causing these deferrals. From that point, different types of examination can be utilized for fixing these issues.
5. Notice what is the obligation of a Data examiner?
The obligation of a Data investigator incorporate,
- Provide backing to all information examination and arrange with clients and staffs
- Resolve business-related issues for customers and performing review on information
- Analyse results and decipher information utilizing factual strategies and give continuous reports
- Prioritize business needs and work intimately with the board and data needs
- Identify new procedure or regions for development openings
- Analyse, distinguish and decipher patterns or examples in complex informational collections
- Acquire information from essential or auxiliary information sources and look after databases/information frameworks
- Filter and “clean” information, and audit PC reports
- Determine execution markers to find and right code issues
- Securing database by creating an access framework by deciding client level of access
6. What is required to turn into an information examiner?
To turn into an information investigator,
- Robust information on announcing bundles (Business Objects), programming language (XML, JavaScript, or ETL systems), databases (SQL, SQLite, and so forth.)
- Strong aptitudes with the capacity to investigate, sort out, gather and scatter enormous information with exactness
- Technical information in database plan, information models, information mining and division procedures
- Strong information on measurable bundles for investigating huge datasets (SAS, Excel, SPSS, and so forth).
7. Rundown of some best instruments that can be valuable for data analytics?
The following valuable tools for data analytics
- Rapid Miner
- Open Refine
- KNIME
- Google Search Operators
- Solver
- Node XL
- Wolfram Alpha’s
- Google Fusion tables
- Splunk
- R Programming
- Python
- Tableau
8. for what reason would you like to be an information investigator?
Generally, this kind of inquiry can fill in as an icebreaker. Notwithstanding, now and then, regardless of whether the questioners don’t unequivocally say it, they anticipate that you should answer an increasingly explicit
With these self-reflective questions, there’s not really a right answer I can offer you. There are wrong answers, though—red flags for which the employer is searching.
A few things you probably want to get across include:
1. You love data.
2. You’ve researched the company and understand why your role as a data analyst will help it succeed.
3. You more or less understand what’s expected of your role.
4. You’re confident in your decision.
9. Where do you see yourself in a decade?
This question can be a bit tricky. There are land mines all over the place. For example, you might be tempted to say you see yourself running the whole joint, but that’s obviously unwise. It demonstrates ambition and enthusiasm, but you’re all but saying you’re going to mutiny the leaders currently in charge.
You also don’t need to be tempted into personalizing this question too much. It can get your off-topic very easily. They’re not interested in whether you want to get married in ten years but rather in your career, and more explicitly your career with the company.
And, of course, avoid suggesting that the company you’re applying to is just a pit stop or a stepping stone. In other words, don’t come off as indecisive or unreliable.
Unlike with most questions, you’re going to want to keep the answer here pretty general, albeit as truthful and candid as you can without foregoing tact.
Sample answer: Within ten years, I hope to have grown with the company and to have advanced professionally toward my ultimate goal of becoming an impactful data analyst, and, eventually, data scientist. And, of course, I’d like to have a comfortable work-life balance and pay down my debts from college.
10. Describe a time when you had to persuade others. How did you get buy-in?
The trick to this question is to demonstrate that you not only persuaded others of a decision but that it was the right decision.
Sample answer As a data analyst intern at my last company, we didn’t really have a modern means of transferring files between co-workers. We used flash drives. It took some work, but eventually, I convinced my manager to let me research file-sharing services that would work best for our team. We tried drop box and Google Drive, but ultimately we settled on using Share point drives because it integrated well with some of the software we were already using on a daily basis, especially Excel. It certainly improved efficiency and minimized the wasted time searching for who had what records at what times.
11. How do you feel about data?
This question is a measure of your enthusiasm and passion for the field; it serves as a pretty good ice breaker or an end passant between questions. Really about the only thing, you don’t want to say is that you don’t have any sort of feeling for data.
Sample answer: I feel that data is king. If you just think about it at a sensory level, data propels everything we do. We take sensory input such as sight, taste, sound, smell, or touch, and we convert that data into actionable insights: only we do it so fast we don’t even realize. But that’s exactly what we do. I’m just the weird type of person who stops to think about the sources of that data and wants to learn what more I can glean from data and how I can use it both more efficiently and effectively.
12. Can you add 1-100 together right now?
This question is straightforward enough. You could, theoretically, compute the solution simply by adding the numbers in sequence, like so: 1+2+3… But this is impractical and probably not what the interviewer is looking for. Fortunately, there’s a formula called a series sum. It’s the number multiplied by itself plus 1, and the resulting solution divided by 2.
Sample answer: Thankfully, there’s a formula that can help with this:
100(100 + 1) = 10,100; 10,100 / 2 = 5,050.
13) List out roughly common issues faced by data analysts?
General mistakes faced by the data analyst
- Common misspelling
- Duplicate entries
- Missing values
- Illegal values
- Varying value representations
- Identifying overlapping data
14. What is the difference between data mining and data profiling?
Data mining is a process in which you classify patterns, irregularities, and correlations in large data sets to forecast outcomes. On the other hand, data profiling lets analysts observed and erase data.
Sample answer: Whereas data mining is concerned with gathering information from data, data profiling is concerned mainly with estimating the quality of data.
15. How have you dealt with messy data in the past?
Up to 80% of a data analyst’s time can be spent on cleaning data. Even more important when you consider that, if your data is unclean and produces inaccurate insights, it could lead to costly company actions based on false information. Yikes. That could mean trouble for you.
You want to validate not only that you know the difference between messy data and clean data but also that you used that information to cleanse the data.
Sample answer: A client angry with our staffing reports, so I needed to pore over one to see what was causing their chagrin.
I found through spreadsheet some of our call canter employees went to break, took lunch, etc., and I noticed that the time stamps were inconsistent: some had a.m., some had p.m., some didn’t have any specifications for morning or night, and worst of all, many of these employees were located in different time zones, so this needed to be made more consistent as well.
To solve the a.m. or p.m. dilemma, followed all specified time in the military format. This had two benefits: first, it eliminated the strings in the data and made the whole column numeric; second, it removed any need to specify morning or night as military time does this inherently. Next, I converted all times to UTC, this way all of the data was in the same time zone.
This was important for the report I was working on because otherwise the data would be presented out of order and it could cause confusion for our client. Reorganizing the report’s data this way helped improve our relationship with the client, who, due to the time discrepancies, previously believed we were understaffed at specific times of day.
16. How many X is in Y place?
This question takes many forms, but the premise of it is quite simple. It’s asking you to work through a mathematical problem, usually figuring out the number of an item in a certain place, or figuring out how much of something could potentially be sold somewhere.
1. “Find how many malls are the in particular city of the country?”
2. “Find how many engineering colleges with adequate facilities are available in state/district?”
Some real examples from Glassdoor are mentioned above.
The idea here is to put you in a situation where you can’t possibly know something off the top of your head but to see you work through it anyway. That’s the trap, though. You don’t want to just give up and say, well, gee, I don’t know. As James Patounas, senior data analyst and associate director at Source One puts it, “I have been asked somewhat related as well as asked something similar. I personally would not admit ‘you can’t really know’ as an answer; or, at least, I would not hire someone that thought this was a sufficient answer.”
Mathematical modeling is normally an approximation of the actual world. It’s rarely a precise representation.
Basically, you wish to pull the info you do have, or at the least can approximate, and work yourself via a solution. Let’s take the number of windows in New York City for instance for the sample answer below.
Note: Statistics in this response do not necessarily convincingly reflect truths; they are estimates (there are actually 8.6 million people in NYC, rendering to 2017 data, for example).
Sample answer: I believe there are about 10 million people in New York, give or take a couple million. Assuming each of them lives in a residential building, with three rooms or more, if there were one window per room that would make approximately 30 million windows. I’m making a few different assumptions that are probably inaccurate. For instance, that everyone lives alone and that the average size of their residences is just three rooms with one window per room. Obviously, there will be a lot of variations in reality. But I consider, in terms of residences, 30 million windows could be close.
Then you’d have to take windows for businesses, subway rail cars, and personal vehicles. If the average subway car seats 1,000 people, with 1 window per 2 seats, that’s 500 windows per car. A little more math: I’d guess there are at least enough subway cars to support the whole population of New York: so 10 million divided by 1,000 comes out to 10,000. So there are another 5 million windows for subway cars.
If half of all people own their own vehicle, that’s another six windows per person, so 30 million more windows. I’d guess there are at least 100,000 businesses with windows in NYC. Let’s just say for the sake of argument there’s an average of 10 windows each. That’s another million. I’m sure there’s way more than that.
Overall, we’re at 66 million windows (30,000,000 x 2 + 5,000,000 + 1,000,000). All of this pretty much hinges on how close I am to the actual population of New York City. Also, there are other places to find windows, such as busses or boats. But that’s a start.
17. You have 10 boxes of cigarettes with 10 cigarettes in each box. All but one box has a cigarette which weighs 10g each. The exception’s cigarette weighs 11g each. How would you determine which box has 11g cigarette using a scale only once?
This question would be really difficult to figure out on the spot. Fortunately, it’s a puzzle with answers all over the place online.
The identifying factor for each of these boxes of cigarettes is weight; fortunately, we have only one different box. Unfortunately, we only have one chance to weigh, so we couldn’t just weigh each box individually.

Instead, we can solve the problem if we put a different number of cigarettes from each box into a new box to weigh it and reverse engineer the identity of the heavier box.
Let’s take 1 cigarette from the first box, 2 from the second box, 3 from the third box, and so on. This way each box we’ve drawn from is uniquely identifiable by the number of cigarettes missing. I have used my middle school-level illustration skills to draw this procedure.

The total number of cigarettes in the box can be calculated now using the series sum formula alluded to in question
5: n(n+1)/2. If we plug the numbers in, we should get 55. Now we have to multiply it by the weight of each cigarette, which is 10g. That means the total weight of the cigarette should be 550g, in a perfect world.
But we’re not in a perfect world. One of these boxes is different. Let’s say, for argument’s sake, the third box is the one that has the heavier 11g cigarette. The weights would look like this: 10, 20, 33, 40, 50, 60, 70, 80, 90, and 100. If you weighed this, in total, it would add up to 553. Clearly, one of these boxes has botched things up. To find out which one, we can subtract 550 from 553, getting 3.
In other words, the third box is the odd one out. The formula, then, would look like this: W – w(n(n+1)/2), where W = total weight and w = weight of each cigarette (except the odd ones).
Note that we’ve labelled the box 1-10 based on the number of cigarettes taken from it. The difference won’t necessarily be this number, however. If the box were more than 1g heavier or lighter, we’d have to do more math. Say, for example, the odd cigarette weighed 12g instead; the difference would have been
6. This still points to the third box because we know that the odd cigarette is 2g heavier than the other cigarette. If we divide 6/2 will get 3
Sample answer: You can find the heavier box of cigarettes by taking a different number of cigarettes, up to 10, from each box, placing them in a new box, and weighing the result.
For example, you take 1 from the first box, 2 from the second, all the way up to the final box, from which you’ll take all 10 cigarettes and place the final box, from which you’ll take all 10 cigarettes and place them in the new box.
If you use a series sum to find the number of cigarettes (or you’ve counted them as you placed them in the box), and multiply the total number by the majority weight (10 in this instance), you can then use this number to find out where the weight “problem” is. Weigh the cigarettes you’ve placed into the new box and subtract this number from the projected weight. The difference will be the box from which you took that many cigarettes. This is the heavier box.
18. What would be your top interview question for prospective data analysts? How would you answer this question?
Suppose that you were provided a flat-file ( Excel, CSV, etc. & #41; to manipulate and load into a database. It contains millions of rows. Suppose that you were provided a flat-file ( Excel, CSV, etc. & #41; to manipulate and load into a database. It contains millions of rows. While loading the database from data, you have to perform an analysis, in case building some type of mathematical model. While you can’t ever be 100% confident that everything was processed and loaded correctly, you can do some things in order to ensure that you are reasonably confident. Describe for me what you would do.
Worldwide valuation: Perform comparative examination of the raw file and the loaded data by the following:
- Count the number of rows
- Count the number of columns
- Sum the numeric columns
- Check the data types (i.e., if I thought that a column was entirely filled with dates then that should persist)
Localized assessment:
- Randomly pick a few rows and manually compare
- Check the distinct elements in textual fields (i.e., if categories A, B, and C exist before, then that’s all I should see after)
- Check conversions if applicable (i.e., if NA is used for non-responses for numerical values then the database won’t accept it if we’re storing the data in a numerical field)
19. Describe the process of data analysis?
The process of data analysis includes data collection, data inspection, data transformation, and modeling data for valuable insights and support the organization with better decision making solutions. The steps which include in the process of data analysis are mentioned below:
Data Exploration: It defines exploring the data for analysis. When a data analyst has identified the business problem, it is suggested to go through the data provided by the client and then analyze the root cause of the problem.
Data Preparation: Data is collected from the client or any other sources are usually in the raw form. It plays an important role in the process of data analysis as it detects the missing values and outliers or any other data anomalies and treats accordingly to model the data.
Data Modelling: Once the data is prepared, the process of data modeling starts where the model is run repeatedly for improvements. It ensures that the best possible result is provided.
Validation: The model developed by data analysts and the model provided by the client is validated against each other to find out if the developed model will meet the business requirements.
Deployment of the Model and Tracking: The final step where the model is deployed and is tested for efficiency and accuracy.
20. List the major differences between data mining and data analysis?
| Data Mining | Data Analysis |
| Data mining usually does not require any hypothesis. | Data analysis starts with an assumption or a question |
| Data mining is dependent on well-documented data and cleaning of data. | Data analysis involves data cleaning. |
| Data mining outcomes are not always easy to interpret. | The outcome after data analysis is interpreted by the Data analysts conveyed to the stakeholders |
| Data mining algorithms automatically develop equations. | Based on the hypothesis, data analysts will have to develop their own equations. |
21. What are the important steps in the data validation process?
Data Validation is basically the process of validating data. This step plays one of the important roles in the process of data analysis. It mainly involves two processes namely, Data Screening and Data Verification.
Data Screening: Various algorithms are used in this step in order to screen the entire data and find out all inaccurate values.
Data Verification: This step is mainly to evaluate each and every suspected value in various use-cases and then decide whether to include those values in the data or not or suppose the values have to be rejected as invalid or if they have to be replaced with some redundant values.
22. What are the different types of Hypothesis Testing?
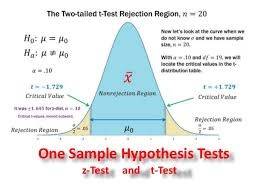
The different types of hypothesis testing are as follows:
- T-test: The typical deviation is unidentified and the sample size is moderately small.
- Chi-Square Test for Independence: To find the significance of the association between categorical variables in the people sample.
- Homogeneity of Variance (HOV): tests the similarity of dispersion parameters in several population samples.
- Analysis of Variance (ANOVA): To analyze differences between the means in a variety of groups and also frequently used similarly to a T-test but, restricted to two groups
- Welch’s T-test: Equality of means between two population samples
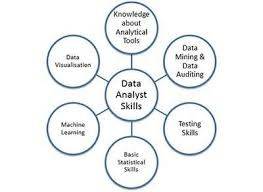
23. Mention the key skills required for Data Analyst.
A data scientist must have the following skills
- Database knowledge
- Database management
- Data Blending
- Querying
- Data manipulation
- Predictive Analytics
- Basic descriptive statistics
- Predictive modelling
- Advanced analytics
- Big Data Knowledge
- Big data analytics
- Unstructured data analysis
- Machine learning
- Presentation skill
- Data visualization
- Insight presentation
- Report design
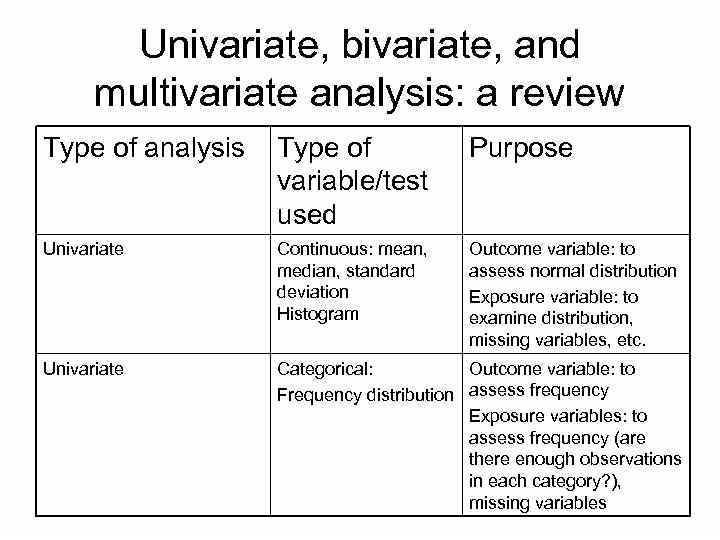
24. Describe univariate, bivariate, and multivariate analysis.
The three types of analysis methodologies have single, double, or multiple variables.
Univariate analysis: It’s only 1 variable and therefore you will find no relationships, causes. The key facet of the univariate analysis would be to summarize the information and discover the patterns within it to produce actionable decisions.
Bivariate analysis: This deals with the partnership between two sets of data. These sets of paired data result from related sources or samples. A few of the tools used to analyze such data includes chi-squared tests and t-tests once the data have a correlation. The potency of the correlation between both t-tests and chi-squared tests will soon be tested in it
Multivariate analysis: This is similar to bivariate analysis. It is a couple of techniques useful for the analysis of data sets that contain more than one variable, and the techniques are especially valuable whenever using correlated variables.
25. What is the difference between linear and logistic regression?
Linear regression is a statistical model that attempts to fit the best possible straight line between the independent and the dependent variables when a set of input features are given. As the output is continuous, the cost function measures the distance from the observed to the predicted values. Linear regression solves regression problems, for example, predicting sales numbers.
On another hand, Logistic regression gives probability as its output. By definition, it is a bounded variable between zero and one, because of the sigmoid activation function. It is appropriate to solve classification problems, for instance, predicting whether a transaction is a fraud or not.
26. What is the time series analysis?
Time series analysis is really a statistical technique that handles time-series data or trend analysis. It will also help to comprehend the underlying forces leading to a particular trend in the time series data points. Time series data is the data that is in a series of particular time periods or intervals. The types of data considered are –
- Time series data – This is a set of observations on the values that a variable takes at different times
- Cross-sectional data – This is the data of one or more variables that are collected at the same point in time
- Pooled data – This is a combination of both time-series data and cross-sectional data
- Time series analysis can be performed in two domains – frequency domain and time domain.
27. What are the types of market research?
Answer:
The two types of market research are:
i. Primary Research: The research done to get first-hand information, i.e. for the first time about a particular subject is known as Primary Data. It is also known as fresh data and is done by the researcher himself. In this case, the data is raw which makes it a very long and time-consuming process to draw inferences from it. This is a comparatively costlier way of conducting the research.
ii. Secondary Research: Secondary research uses information from the research conducted by other people. The required information is already published in the public domain and is available directly for consumption. Since the data here is already available, this research does not take a long time. All that you have to do is collate, analyze, and interpret the data. It is faster and cheaper out of the two ways.
28. How is the research classified on the basis of the type of data required?
Answer:
Depending on the type of data required market research is divided into two types:
i. Qualitative Market Research: This type of research is done when you want to get insight into the opinions and feelings of the consumer with respect to the products and services of the company. This is done through one on one interview or by forming a focus group.
ii. Quantitative Research: This is done when facts and statistics are more important. It involves working on a large amount of information from statistics.
29. Which study would you wish – Primary or Secondary?
Answer:
Depending on factors such as your requirement, budget, the timeline you can choose the best research type for your project.
Primary and secondary data both have their own advantages and disadvantages.
In primary data, as the research is done by the researcher himself, it’s more authentic and accurate. But at the same time, it is expensive and time-consuming.
In Secondary research, the data collection is quick and comparatively cheaper than primary research. However, the data may be outdated and may not suit your requirement.
So, I would prefer to choose the kind of research based on my project.
30. What are the various research tools used for Primary Research?
Answer:
Primary research is accurate though expensive and time- consuming. It is mostly done when it is the only way to get information or the researcher doesn’t rely on the available data.
The different tools used to conduct this research are:
i. Surveys: It is a series of questions asked to get feedback about a particular product or service. These questions can be shared with people over the phone, on paper or online using survey software.
ii. Questionnaire: One of the most widely used tools of primary market research. It is a set of questions that you ask your potential customers.
iii. Focus Groups: Focus groups are a bunch of people with similar characteristics, like their age, hobbies, etc. Focus groups help to understand their likes and dislike with a product. You can get feedback about a particular product, an ad campaign, or a new feature.
iv. Interviews: Here, you ask people the questions face to face to understand their preferences.
v. Observation: This is the simplest form of primary market research. Here the researcher observes the subject and notices how he/she makes the purchase. Understand their preferences and behaviour.
31. What are the sources of secondary research?
Answer:
Secondary research is mostly conducted to understand market trends or to understand if there are any changes in the preferences of the people. It is something that has been collected and analysed by someone else. Some of the sources of data for secondary research are:
i. Official publications by the Central and local government.
ii. Reports submitted by research scholars, economists.
iii. Reports submitted by research and educational institutions.
iv. Newspapers and periodicals.
v. Trade journals specific to your industry.
vi. Online websites
vii. Unpublished data maintained by private firms, business enterprises, research workers, etc.
32. Why do we do market research?
Answer:
Market research helps in understanding consumer’s needs and preferences, if they are satisfied with the product or not, what are their expectations, etc. Also, it helps the marketer to get the right product at its right place and price.
Following are the ways in which Market Research is useful:
i. In preparing market strategies: In the global market with intense competition, contacting customers, controlling distribution, predicting customer’s needs, market segmentation is difficult. Research data helps in preparing market strategies.
ii. Understand consumers ‘needs and wants: Market research helps in collecting information on consumers and helps in making marketing consumer-oriented.
iii. Identify opportunity: Market research helps in identifying new opportunities for new and upcoming products.
iv. Keeps you closer to your competition: It helps in knowing their products, their strategy, and their status in the market. Once you know them well, you can deal with them better.
v. Reduces risk: Market research gives you data that is analysed. It reduces risk.
vi. New trends: Market research helps you spot and anticipate the new trends in the market.
vii. Determine your advertisement medium: Market research focuses on the correct audience which helps to choose your medium of advertisement for your product or service.
viii. Problem-solving: Market research helps firms in identifying and solving the problem at an earlier stage.
ix. Improves Sales: Market research helps to identify sales territories, shortcomings in sales, and examine alternative distribution methods that improve the overall sales.
x. New products: Market research helps in the introduction of new products. It helps in controlling the risk involved in introducing a new product in the market.
33. What are the two most important factors that decide the scope of market research?
Answer:
Market Research is a time taking and money consuming exercise. So, the two most important things you need to consider are:
i. Your budget
ii. Timeframe
34. Discuss the steps to transport out market research.
Answer:
Here will be the steps we usually undertake to transport out market research:
i. Identify your research purpose. Define your objective for research. Why do you want to conduct the study? What information you will need out of this research.
ii. Define your target audience.
iii. Collect data from various sources.
iv. Conduct a proper analysis of the data.
v. Ready your report on the cornerstone of your analysis.
vi. Communicate results.
35. What are the normal mistakes you ought to avoid while preparing your survey questions?
Answer:
A research analyst knows what questions to ask in the survey but a well-written survey will enable the respondents to answer them correctly without getting confused.
Here will be the forms of question a researcher must avoid in his survey:
i. Avoid Prominent question: A prominent question includes non- unbiased wordings. It will take the reader to 1 side of the argument. Example: Do you have a problem with your boss? It indicates the prospects of having some problems. Instead, you can ask: how can be your relationship with your boss?
ii. Avoid burdened questions: Burdened questions contain an assumption within it. These questions force the respondents into an answer that doesn’t reflect their opinion or situation. For e.g.: exactly why is the sky blue? Is really a loaded question. Instead, you can ask what the color of the sky is.
iii. Avoid Double Barrelled question: This can be a common mistake in every survey. Here the surveyor asks two questions in one. Example: Is this box interesting and useful? Instead, you might ask, Is this box interesting? And is this box useful? In two separate questions.
iv. Ask clear questions: The language you are using in the survey should really be clear, concise, and uncomplicated. If you can find any difficult terms in the survey, explain them. Do not confuse the respondent. Example: What’s the state of cleanliness of the kitchen? Instead, you might ask: How clean can be your kitchen?
v. Avoid Destructive questions: Questions with no, not, none.
vi. Avoid questions that do not affect a big change: For example, do not ask if students will prefer a morning batch if you are not planning to supply one.
36. Name some standard and widely used statistical data analysis approaches for market analysis.
Answer:
Typically the most popular market analysis tools are the following:
i. SWOT Analysis: SWOT means Strength, Weakness, Opportunity, and Threats. It indicates your organization identifies the strengths and opportunities from the business point of view and eliminates weaknesses and threats.
ii. Gap Analysis: Gap analysis is performed to gauge the difference between actual performance and the desired performance. If there is a distinction between the 2 helps you to know what needs to be done to attain the specified position.
iii. MaxDiff Analysis: It is performed to understand consumer preferences across product attributes such as product branding, feature, advertising, etc. This analysis is user friendly and implement.
iv. Trend Analysis: It will help to identify and predict future trends in the data movement. Trend analysis works on the fundamentals of what has happened in the past and gives an idea of what’ll happen in the coming time.
v. Conjoint Analysis: It is performed to understand different options that come with a product or service from the customer’s point of view.
37. As a Market Research Analyst, what’ll you do to get more information from your own team members out of the daily process of interaction?
Answer:
Every day our staff does plenty of market research in the daily routine. A market research analyst should be able to identify what should really be collected and here certainly are a few ways whereby it can be achieved in their daily process:
i. Allow the staff to find out about these details gathering process and how it can benefit to improve business.
ii. Ask the staff to keep an archive of important information.
iii. Hold unvarying meetings just to interchange market research information. These meetings will help to identify new trends and the staff member will ensure to get something useful before visiting these meetings.
iv. The information gathered from the aforementioned meeting can help to decide what improvements can be produced in the business.
v. Assign personnel with certain market research areas. For example: If someone likes reading ask that member to keep a guide of competitor’s newspaper articles and articles from industry journals.
vi. Allocate funds for market research in your budget.
38. What are the main element responsibilities of a market research executive?
Answer:
The important thing responsibilities of a market research executive are:
i. Do appropriate Primary and secondary market investigation to identify new opportunities.
ii. Prepare questionnaires.
iii. Data collection through various websites.
iv. Prepare a presentation to provide the findings of the study to the client.
v. Identify market segments and estimate market demand.
vi. Negotiate contracts for research projects.
vii. Prepare and manage budgets.
viii. Manage and monitor the progress of data collection.
ix. Assist in conducting surveys and interviews.
39. What are the main element skills required to become a successful market research analyst?
Answer:
A number of the main skills required to become a market research analyst are the following:
i. Attention to details and accuracy
ii. Good analytical ability.
iii. Excellent understanding of statistics.
iv. Physical strength and capability to work under pressure.
v. Strong IT skills
vi. Ability and flexibility to understand
vii. Good organizational skills.
viii. Excellent communication skills.
And especially, plenty of patience in order to complete what you have started.
While going for an interview, be sure that you have some examples ready to tell the interviewer that you do possess these skills and qualities.
40. Does your candidate choose to get a lot of space to complete their particular work, or do they prefer a more hands-on style with a lot of direction?
Marketing is a realm that can be a melding of creativity and business structure. Oftentimes, these qualities clash in place of meshing peacefully. Ensure your candidate knows how to stay professional, composed, and diplomatic because of the situation:
“Describe an occasion once you had to work well with highly creative people. That which was the relationship of your project?”
Try to have some insight into how they communicate in the job environment.
41. What Is Marketing Research?
Answer :
Marketing research is the systematic gathering, recording, and analysis of data about issues concerning marketing products and services.
42. Why Is Marketing Research Important?
Answer:
Marketing research is very important simply because we–web marketers– need such information to create our marketing decisions. The more accurate the information we’ve, the less likely we are to create mistakes within our decisions.
43. What Is A News Article?
Answer:
A news article is a gathering of facts compiled by journalist published in the news headlines or the print media.
44. What Is Photo Editing?
Answer:
The photographs affecting negatively to the public sentiment and psychology must certainly be avoided. Thus before publishing a photograph in virtually any media it needs to be edited if the photo has some massage to the public and must look into the public interest
45. in what way Can You Use Word-of-mouth As a Marketing Tool?
Answer:
You can generate it by supplying a new, high quality and unique product or service that is reasonably priced
46. How Do I Identify I Am Success My Target Audience?
Answer:
To improve your ability to reach your audience, consider using demographic, geographic, or psychographic profiles.
47. What Features Should Be Measured When Choosing A Media Vehicle?
Answer :
There are six factors to think about whenever choosing a media plan. The factors like budget, audience, and sales objectives..
48. What Is More Important: Reach Or Frequency?
Answer :
Both are essential, you’re marketing plan and sales objectives should dictate the level of each.
49. How Can We Learn More About, Target Audience?
Answer :
Understanding the mark customer guides us for making the right advertising decisions, from what to state to which medium to use.
50. How Can We Evaluate The Effectiveness Of Advertising?
Answer :
To be able to determine the success of advertising, we should have measures set up that may determine the return of advertising investment.
