Consider using a Fishbone diagram the next time you undertake an internal company process improvement project. This visual cause-and-effect analysis tool assists you in identifying the various reasons for a problem in your quality control chain, allowing you to address and resolve issues at their source. This article will help you with all you need to know about Fishbone Diagram in 2023.
 Book Free Strategy Call
Dr. Ishikawa said “Think of at least four factors which influence your problem. See if a shift in one of these causes can give you a different effect to explore”
A fishbone diagram is also known as cause and effect diagram, herringbone diagrams, Ishikawa diagram or Fishikawa.
It is a visualization tool for classifying the potential causes of a problem in order to identify its root causes.
Ishikawa fishbone diagram is typically use for the root cause analysis. Although, fishbone diagram combines brainstorming with a type of mind map template.
Additionally, the diagram is helpful in troubleshooting processes and product development.
Once the team brainstorm all the possible reasons for a problem, the facilitator helps team rating the probable causes according to their level of importance and diagram a hierarchy.
Detail Explanation of Fishbone Diagram
The design of diagram resembles skeleton of a fish. Ishikawa fishbone diagrams are normally work right to left.
Each large “bone” of the fish branch out to include the smaller bones containing more details.
Dr. Kaoru Ishikawa was a Japanese quality control expert. He credit for inventing the fishbone diagram for helping employees avoid solutions that address only the symptoms of a much larger problem.
Ishikawa fishbone diagrams are consider one of the seven basic quality tools. These are use in the “analyze” phase of Six Sigma’s DMAIC (define, measure, analyze, improve, control) approach to problem solving.
It is a diagram that shows the causes of an event and is often use in manufacturing and product development to outline the different steps in a process.
It shows where quality control issues might arise and determine which resources are require at specific times.
The Ishikawa Fishbone diagram was develop by Kaoru Ishikawa during the 1960s as a way of measuring quality control processes in the shipbuilding industry.

The iconic Mazda Miata car was design to overcome the issues identify in an Ishikawa fishbone diagram.
Variation = Imperfection
When it comes to quality and efficiency, variation is our enemy. Whatever your business is, you do not want to leave anything up to chance.
From the moment your client contacts you, a predictable process should follow with its aim being complete customer satisfaction.
Variation in the process means variation in the product.
Ishikawa fishbone diagrams help you to determine the variables that may enter the equation.
They allow you to make your plans so that you know how to deal with them in such a way that the quality of your final product is still up to standard and without significant variation.
The Ishikawa fishbone diagram strives to pinpoint everything that’s wrong with current market offerings so that you can develop an innovation that does not have these problems.
When to Use Fishbone Diagram
Ishikawa fishbone diagrams can be use by most of the entrepreneurs and almost any industry or person having a problem.
Professional diagramming software may help creating Fishbone (Cause and Effect or Ishikawa) diagrams.
When people are unclear about what is causing an issue, ConceptDraw DIAGRAM can be helpful.
Originally developed as a quality control tool, Ishikawa fishbone diagram may be helpful in the following activities:
- To analyze a complex issue when there are multiple causes.
- For identification of all potential root causes for an effect or a problem.
- A different point of view is a need to look on a problem.
- To uncover bottlenecks and identify where and why a process does not work;
- For accelerating a process when traditional ways of problem solving take long time.
Visit Our Other Courses
- Six Sigma Green Belt Certification
- Six Sigma Black Belt Certification
- Six Sigma Master Black Belt Certification
Categorizing Sources of Variation
The possible causes of variation might be several but they will always fall into the following categories:
Find ways to ensure that people involved in a process know what to do and when to do it.
- Methodologies: Consider the need for policies, rules, regulations, or procedures to ensure consistent quality.
- Machinery: Anything from the assembly line robots to tools or even computers.
- Materials: The materials need to produce a quality product cannot ignore.
- Measurements: How is the process measure and monitor to evaluate quality?
- Environment: This includes anything outside the company’s control that may impact on results.
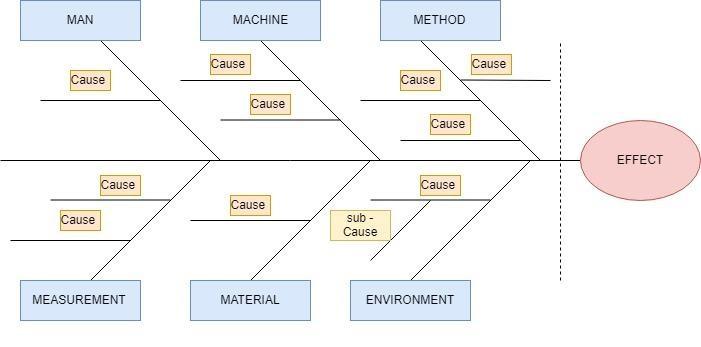
When drawing up fishbone diagram, use these six categories to feed into the “spine” of your fish skeleton drawing.
The sub-factors can be denote by similar small bones attach to the line indicating the category under consideration.
How to Use a Fishbone Diagram?
Kaoru Ishikawa, a Japanese professor and a quality management innovator of his time, used this tool for the first time when he worked with the Kawasaki shipyards in the quality management process.
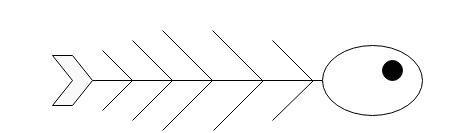
The “head” of the skeleton depict the problem, effect, which is usually on the right. The “bones” extend on the left to show the different causes.
Categories or classification of causes for the analysis denote ribs, which branch out into causes and sub-causes.
The branching changes based on the levels required under each classification.
Toyota Company prompted a classification concept of 6 Ms. Sometimes it includes Management and Maintenance along with the categories mentioned below.
The 6 general categories of analysis are:
- Man
- Machine
- Material
- Method
- Measurement
- Mother Nature/ Milieu (Environment)
A few marketing industries use the categories as 7Ps:
- Product
- Price
- Place
- Promotion
- People
- Positioning
- Packaging
And some Service industries use the 5Ss:
- Surroundings
- Suppliers
- Systems
- Skills
- Safety
Drawing a Fishbone Diagram

- Draw the head on the right which contains the problem (effect or issue) for analysis.
- Draw a straight line from the head, leading to the left. This is the backbone.
- Identify the areas, broad level categories, to be studied and branch them from the backbone.
- Analyze the causes from these categories that contribute to the effect. Connect these causes to the category branches respectively.
- Break down the causes into sub-causes, till you cannot drill down further causes.
The fish-bone diagram can be created either by an individual or by a team of people. The first step is to identify the problem.
Sometimes the problem can seem to be a symptom too. It is important to understand that the heart of the fishbone is not the effect, problem or symptom, but the cause of it.
Once the problem has been found out, a brainstorming session will take place, individually or in a group, to find the causes.
The people involved should come up with all the possible causes of the effect.
A step-by-step guide to find the causes:
- Identify the problem to be analyzed
- Take up categories of causes for analysis.
Here, taking the categories of 6Ms, ask the following questions:
Man: Any man/people related causes to the problem?
Machine: What are the machine-related problems?
Method: What is wrong with the method associated that is leading to the problem?
Measurement: Any standard error or tool that needs rectification?
Material: Which changes occurred in the properties of the material?
Environment: What were the environmental conditions (temperature, pressure, etc.)?
- Drill down further, by asking “Why” to the first level of causes.
- Note these cases against the major categories.
After all the possible and potential causes have been identified, these causes must be rated. The rating is done based on the impact of the cause on the effect.
The rating will decide the importance and criticality of the cause and shall be worked upon. The brainstorming session will continue to rate the different causes.
Based on the highest rating, the solutions will be proposed.
The following points should be taken care while making a fishbone diagram:
- The problem should be clear.
- There should be no doubts regarding the problem.
- The individual or the team member who are trying to identify the causes should be experienced. This prevents from missing out important causes of the problem.
- The brainstorming session should be focused and objective oriented. All possible causes should be identified. Only after all the causes are identified, they are rated.
- The clarity of the fishbone diagram must not be lost with the increase in the number of bones.
Fishbone Diagram Example
Fishbone Diagram Example 1: ABC Manufacturing Pvt. Ltd.
ABC Manufacturing Pvt. Ltd has a production unit that produces iron nails. Recently, they started facing an issue wherein nails were not conforming to their standard dimensions.
Also, the nails were getting rusted by the time they were set for delivery. Here is the fishbone diagram example for the company.
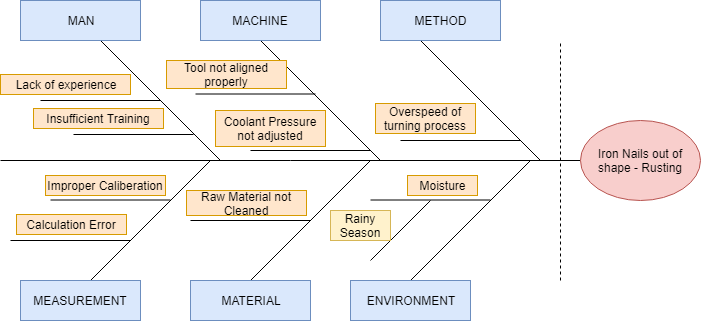
The main problem is on the right, “Iron nails out of shape – rusting”. This means the problem that is dealing with the incorrect dimensions of the nails due to rust.
The nails are rusty and out of dimension. After that the main categories are identify and the potential causes from each of the categories identify.
The man category has two causes.
There is a cause that the workman working on the nails production does not have enough training.
The person is not experience enough with the method, machines or working process of the iron nails.
As a solution, company could give adequate training to the workmen working on the nails production unit.
Machine: The tool use to shape the nail was not align accordingly.
The pressure of the coolant that is use to mitigate the heat develop during machining cause the movement of the workpiece leading to a discrepancy of alignment.
A thorough check of the machine and the machining operations should be done to get the desired nails.
Method: The workpiece is moving too fast which is leading to a distorted dimension of the nail.
Measurement systems like tools are referred to here. For measuring the material, tools may not be used correctly. There could have been calculation errors
Material: The raw material was not cleaned properly. As a result, the nail was out of dimension when a machining operation was conducted on the nail.
A cause and a sub-cause are there in the environment category. The cause is moisture.
Question: Why there was moisture in the atmosphere?
Answer: It was the rainy season.
This is the root cause from the Environment category. Now, the organization can look for solutions for overcoming the problem of moisture content, especially if it was rainy or humid weather.
One important point to note is that the categories mentioned are only to give a sense of direction. All problems may not be caused by each of these categories. The categories can get changed depending on the problem or industry.
Fishbone Diagram Example 2: XYZ Pvt. Ltd
A company, XYZ Pvt. Ltd. identified that their sales of a particular Product A fell by 36% in June this year.
The company decided to find the root cause of fishbone analysis. Here is the fishbone diagram example that was projected.
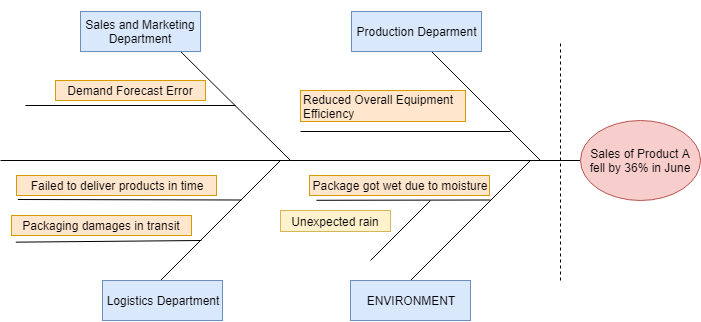
The example shows that there are no six categories and only one of them is used, that is the Environment.
Also, the company wishes to study the department wise causes of the problems and thus they have categorized the causes into three key departments and noted the respective causes.
A simple technique to drill down the causes is to ask, “Why” to every cause. For example: Why did the package get wet due to moisture? Answer: Unexpected Rain
Four Types of Fishbone Diagrams
We all have done brainstorming at some point in our lives.
Those sessions may have been jumbled up at times with ideas coming from different direction or structured with the help of a particular diagram.
Since the late 1960s, Ishikawa diagrams have helped millions of people through the process of brainstorming potential causes of an effect or problem and mapping those relationships.
Due to the focus, shape and design, these diagrams are more commonly call as cause and effect or fishbone diagrams.
Fishbone diagram examples provide a great way to brainstorm within a well-defined structure. We need to know how to fully use them and the types of diagrams that are available.
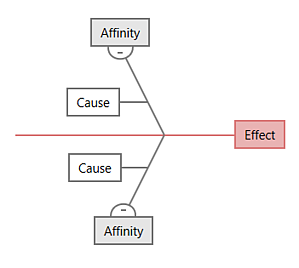
Each fishbone diagram example starts same way: a central effect or problem is place on the far right of the diagram.
Then a line, which is called the “spine”, is drawn straight to the left and branches are add off shooting both above and below it.
Branches are “affinities” or types of causes from the spine of the central problem or effect. Then specific causes are add to each of the affinities while brainstorming.
This continues until brainstorming session is completed and you feel satisfy with your fishbone diagram.
Since everyone can use a fishbone diagram example to help them brainstorm and there are so many industries and uses, there are a few types of different types of fishbone diagram example available.
Below are the four most popular:
The Simple Fishbone
The fishbone diagram has no predetermined affinities or categories of causes in its most basic form.
Hence, affinities can set and create that may be unique to an organization or industry.
Let us take the following fishbone diagram example: a health care system may have affinities that would not be applicable to a manufacturer and vice versa.
Even the manufacturers can have different affinities because of the array of products they are producing, like food, automotive parts or electronics.
The 4S Fishbone
This type of fishbone diagram got its name from the way it classifies information about potential causes into four common categories: Suppliers, Systems, Surroundings and Skills.
It is commonly use in the service industry. But it can use in nearly any industry.

The 8P Fishbone
This type of fishbone is name as 8P because of 8 categories that make it up: Procedures, Policies, Place, Product, People, Processes, Price and Promotion.
This variation is also commonly use in the service industry but can be use in nearly any type of industry or business.

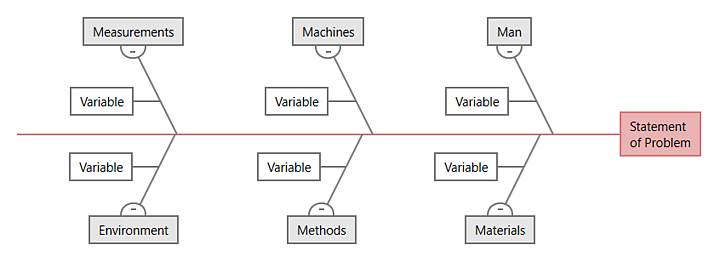
The Man Machines Materials Fishbone
This fishbone diagram variation is most commonly use in manufacturing and allows to organize potential causes of a problem into these categories: Man, Materials, Machine, Methods, Measurements and Environment.
In a few cases, two more categories are include: Management/Money and Maintenance.
Benefits of Fishbone Diagrams
Fishbone diagram example is very useful because it shows information in a comprehensible and neat way.
There are 5 major benefits of fishbone diagram example:
- Clear and logical display of relationships: The fishbone diagram example captures the links and relationships among the potential causes and results displayed in the diagram. The correlation at a glance is categorize logically.
- Display all causes simultaneously: Any cause or causal chain appearing on the fishbone diagram example can lead to the problem. The fishbone diagram example explains each and every possible reason in a single diagram.
It is beneficial for the in-depth analysis. This makes it a useful tool for presenting the problem and solutions to stakeholders.
- Facilitate brainstorming: Edraw fishbone diagram is a very good way to structure and boost the brainstorming about the reasons for a certain result because it captures all the causes.
- Stimulate problem solving: Checking the reasons in the visual graph and investigating the root cause may stimulate team to find out possible solutions for the problems.
- Help maintain team focus: The fishbone framework can keep team focus while you discuss what needs be done to achieve a common goal or solve the problem.
It helps to analyze every involved party. And it ensures that nobody is wasting energy chasing nonexistent problems.
Conclusion
It is a very important tool in identifying the root cause, though its development is time-consuming.
Owing to its immense benefits, the fishbone diagram is use across different industries like manufacturing, project management, service industries, etc.
The value of Ishikawa fishbone diagram depends on how to develop diagram.
The experience level, knowledge, critical thinking, training, etc. of people involved play a major role in the successful drafting of the fish-bone diagram.
It is important to involve experienced experts to draft the fishbone diagram and ask multiple “whys” to find the root cause.
The Ishikawa fishbone diagram is also a great way to find out and prevent quality problems before they ever arise.
fishbone diagram can be used to troubleshoot before there is trouble and we can overcome all or most of the teething troubles when introducing something new. It is very helpful in identifying the root causes of the problems in the Six Sigma DMAIC approach.
Recommended Reads
- Best Six Sigma Course in India
- Best Six Sigma Courses in Bangalore
- Best Six Sigma Black Belt Courses in Delhi
- Best Six Sigma Courses in Chennai
FAQs
Q1. What is a fishbone diagram?
Fishbone diagram is also known as cause and effect diagram, herringbone diagrams, Ishikawa diagram and Fishikawa.
It is a visualization tool for classifying the potential causes of a problem in order to identify its root causes. Moreover, ishikawa fishbone diagram is typically use for the root cause analysis.
A fishbone diagram combines brainstorming with a type of mind map template.
Q2. Who invented fishbone diagram?
Dr. Kaoru Ishikawa was a Japanese quality control expert.
He credit for inventing the fishbone diagram for helping employees avoid solutions that address only the symptoms of a much larger problem.
Ishikawa fishbone diagrams are consider one of the seven basic quality tools. These are use in the “analyze” phase of Six Sigma’s DMAIC (define, measure, analyze, improve, control) approach to problem solving.
Q3. When to use a fishbone diagram?
Fishbone diagrams can be use by most of the entrepreneurs and almost any industry or person having a problem.
Professional diagramming software may help creating Fishbone (Cause and Effect or Ishikawa) diagrams.
When people are unclear about what is causing an issue, ConceptDraw DIAGRAM can be helpful.
Q4. How many types of fishbone diagrams are there?
Four types of fishbone diagrams are there:
- The Simple Fishbone
- The 4S Fishbone
- The 8P Fishbone
- The Man Machines Materials Fishbone
Q5. Is fishbone diagram effective in finding potential causes?
It is a very important tool in identifying the root cause, though its development is time-consuming.
Owing to its immense benefits, the fishbone diagram is use across different industries like manufacturing, project management and service industries etc.
Ready to Start Your Learning Journey?
Join thousands of learners and build your future with expert-led courses and 100% practical training.
- Expert GuidanceLearn from industry experts
- Trusted & RecognizedTop-rated by learners
- Flexible LearningOnline & offline options
- Placement SupportCareer support & more
E&ICT IIT Guwahati Best Six Sigma Green Belt Program
Ranks Amongst Top #5 Upskilling Courses of all time in 2021 by India Today
View Course