Engross yourself in this post if you would like to know why Six Sigma rose to popularity among business owners.
What most people did not like to see in their business is unpredictability. Surprises mean no control on the business process. Faced with this challenge of unpredictability business owners were searching for a technique that provides them with better control of their business processes.
This lead to the discovery of Six Sigma a high discipline methodology for measuring variations and improving product, process and Service. Six Sigma approached is based on a statistical formula that measures the deviation between the process mean and the nearest specification limit in sigma units. That is why Six Sigma is also a data-driven approach which depends on data collection methods for data. There exist different types of data collection technique that we shall see one by one.
About Six Sigma
A small story that I want to share how Six Sigma originated before we dive deep.
 Book Free Strategy Call
In the early 1980s, like many American companies, Motorola was reeling under threat from Japanese companies. Japanese were well ahead in producing a quality product at a very competitive cost. Faced with this challenge of better quality and undercutting rate, Motorola started incurring a grave loss in profitability and market share.
The top management at Motorola swung into action and put an ambitious plan to deal with Japanese competition.
It was at this time the management of Motorola called all their engineers and set the target of reducing the number of errors in the product even before they are shipped out.
The engineers of Motorola combined all TQM process they Knew at that time to formulate a methodology to form a baseline for the quality improvement program.
It was then in 1986 Bill Smith, an American scientist at Motorola, quietly designed a methodology to standardize defect measurement and improve manufacturing quality. Six Sigma was the name given to this technique.
Using Six Sigma process the Motorola saw a high degree of improvement in their products. The error reduces by 99.99966% or 3.4 defects per million opportunities.
Motorola now uses Six Sigma as a collaborative effort between the customers, the suppliers and the stakeholder and in addition to this, it is also a vital tool to engage employees for cultural change and continuous improvement.
Six Sigma implantation saved $16millions for Motorola.
With the assistance of their (Motorola) former CEO Bob Galvin, The Six Sigma method was made available to the world. Besides, implementing large size training efforts, Six Sigma went beyond the manufacturing boundaries by implementing it in engineering, services, support and transactional companies.
Read About: Six Sigma Green Belt Course In Delhi
The belt levels concept in Six Sigma
Michael Harry called Bill Smith father of Six Sigma and called himself Godfather of Six Sigma. They together started exploring the standard problem-solving method. This combined effort resulted in four-phase problem-solving method coined as MAIC (Measure Analyse Improve and Control) later known as Six Sigma.
It was Michael Harry who introduced the concept of belt levels in Six Sigma. On the request of his client Unisys he designs catchier terminology borrowed from Judo Karate belt levels. He changed the project level designation from process characterisation experts to black belt, which was immediately accepted by Unisys.
So Now there are three main belts in Six Sigma


- Master Black Belt
- Black Belt
- Green Blet
Later on, one more belt was added the Yellow belt for the entry-level.
Role and responsibility of these belt levels:
Master Black Belts (MBB): Their responsibilities are to provide day to day leadership on Six Sigma projects. Also, they provide training to Six Sigma Master Black Belt Certiication acting as a connection to the Sigma project team and top leadership.
Black belt (BB): Lead Six Sigma Black Belt Certification projects and trains and mentors Green belt and yellow belt. They are 100% devoted to Six Sigma project.
Green Belt (GB): GB work on a part-time basis on the Six Sigma project. Any individual who has completed Six Sigma Green Belt Certification devotes no more than 10% to 50% on the Sigma project. Green belt assists Black Belts on carrying out lean Six Sigma projects. Data collection methods training is also provided to green belt holder.
Yellow Belt (YB): YB can be an entry-level employee on the project. They have done the foundation course of sigma and have acquired basic knowledge of it. In the Six Sigma project, they assist the Green belt and black belt. Data collection methods can be one of the task YB performs in some projects.
Let us understand more about Six Sigma :
We know that Six Sigma is not a product or Technologies but an attitude which derives a cultural change. Therefore you can also say that it philosophy which pushes you towards continuous improvement concerning customer expectation in terms of customer satisfaction, customer retention and sustenance of business products and services.
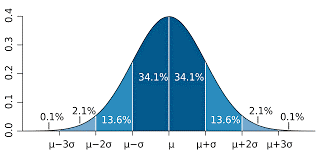
It is a data-driven approach using a statical formula to find the standard deviation. Six Sigma considers only six deviation events from the mean for an error to happen. To make it more clear, in a distributed process if the result is between the mean of ±3σ range of the output of USL and LSL then around 99.9997 area of the output will non-defective. This means 3.4 defects per million opportunities.
The Measure Phase:
In the DMAIC ( Define, Measure, Analyze, Improve and Control) process, the Measure phase focuses on the data collection method. Green belt Six Sigma profession will understand how important this tool is and will concentrate more on this effort of the data collection method.
The purpose of this phase is to decide the critical measures that are necessary to assess the success, meeting significant purchaser requirements and begin developing a method to effectively gather data to quantify course performance.
There are several tools used in this phase like data collection method, process mapping, Histogram, capability analysis, leading and lagging metrics, descriptive statistics, sample size gathering. It’s up to the project leader who determines using one or more tool.
In this phase, a planned data collection method utilizes efforts and resource in a systematic way that is relevant to the project. A sound data collection methods avoid wastage of efforts and resources in collecting data that has no use to the project.
To able to answer a specific question that is relevant to business value a data collection method is the best way approach.
Read About: Six Sigma Green Belt Course in Noida
How to create a data collection method in Six Sigma?
Identify what you want to measure.
In the data collection method, first, we need to know what we want to measure. Therefore we need to first develop a question for issues that we are trying to solve.
How do you establish the measures for process performance? What are the criteria for evaluating successful process? Is there any service level agreements (SLA’s) and what are the parameters for there evaluations? Include all metrics identified on the project charter in these methods.
Create an operational definition:
In Six Sigma operational definition can be described as a clear understanding of what you want to observed and measured, so the data collected, used and interpreted by professional are consistent. Therefore, it requires the development of a common definition for the matrics to be evaluated. The evaluation of metrics must be specific about the item to be measured along with the condition that needs to be applied to the plan.
Six Sigma requires every member on the same page, so that when they are defining the process of data collection method, everyone on the project is agreeing to it.
Read About: Six Sigma Green Belt Course in Gurgaon
Determining the data Source and type of data availability:
Identify the data source from where the data will be collected. One of the best ways to collect the data is through a SIPOC diagram. Also, Identify the data source for historical data. Historical data provides insight into the process performance.
There are three resources from where data is generated that is process, input, output.
Process: the data from here refers to tests of efficiency, the time needed, cost, value, defects, and labour utilized on the process.
Input: It is the place where the source is generated.
Output: It provides a measurement of efficiency.
Identify what data sample size required:
In this phase, we have to identify what types of data collection is required. What should be our sample size? If the sample size large then the chance of getting a pattern and trends become more clear.
Data Evaluation:
In this phase, the collected data sample evaluated and checked for deviation. The result that we get due to calculation of sigma gives the exact number of defects.
In Sigma, defects are define anything outside customer specification.
In this phase, we know many defects per million opportunities. From the result, we can take corrective action and move towards improvement.
Implementation and refinement plan:
We have to take care of our implementation plan. Start with the pilot test. Review and improve before going out full-blown on the project.
Check Out- Six Sigma Green Belt Course in Mumbai
Data types in six Sigma and their classification:
In Six Sigma, you will come to cross different type of data. There are mainly two types of data 1) Qualitative data and 2) Quantitative data.
Qualitative data: Qualitative data is more descriptive and will give more information about an object like its colour, shape size, material and other observations. Such data are not measurable by numbers.
Voice of Customer (VOC) will give a lot of information on the quality of products because of its descriptive value.
Quantitative data: Quantitative data is measurable and objective nature. Examples of such Data are timing, weight, height, length, etc. You can perform a calculation or use statistic formula on quantitative data.
There are two types of quantitative data 1) Discrete and 2) Continuous.
Discrete Data: These data are whole numbers. You cant fraction them or half them. They are opposite to continuous or variable data. In other words, you can count them like how many some object is present.
- How many numbers of pen
- Pass/fail data, quality pass or fail
- Numbers of errors in software program
- Total number of months in a years
- Number of defects in a lot
- Total number of staff in the office
Discrete data:
Discrete Data can be broken down into three basic types of data.
- Ordinal: These types of data can be put in an order, like 1st, 2nd, 3rd or have a rating scale attached. They can count but cannot be measure. For example: Supposed a cold drink server to a group of children. Then they were asked to rate the drink on the scale of 1-5. 1- represent strongly disliked, 2-represent disliked 3-represent neutral, 4-represents liked and 5-represent strongly liked. In this example, the rating of 5 represents more enjoyment and liking of the drink then the rating of 4.
- Nominal Data: Nominal data can are descriptive data like colour, names phone number, types of a scooter, etc. this order is not in inherent order. These types of number are labels assignment of numbers and are represented by category or classification. They are also called categorical data.
They form a discrete data that are usually of two categories. The discrete data should apply to the nonparametric test for analysis.
Binary: This types of data are qualitative or categorical data like yes-no, on-off, good-bad, pass-fail, etc.
Continuous data:
It is also known as Variable data. This continuous data is from Measure Phase of Six Sigma.
Examples of Continuous Data are- time, money and any physical measurements such as height, weight, length and temperature. It can take any value on a Continuous Scale, such as profit, temperature, cycle time.
The continuous Data can have fractions and decimals values, in other words, we can say it can meaningfully subdivide it smaller parts as per the measurement.
- The general rule is that continuous data are not counted
- The continuous data can be divided into smaller and smaller part.
- The continuous data is measurable.
- It can have an infinite number of possible values within an interval.
- It has graphically represented by histograms.
Data Types In Six Sigma
| Sr.No | Measurement | Discrete | Continous |
| 1 | Height | Tall/medium /short | Meter |
| 2 | Weight | Fat/Slim | KG |
| 3 | Student Performance | Good/Average/Poor | Percentage |
| 4 | Speed | Fast/Slow | Kilometre/hour |
Types of data collection methods
The success of any company depends on how it delivers on its processes. The project leader, the Black belt need to carefully study the present processes by collecting present and historic data by using tools and methods & develop insight before planning to improve the process.
Successful data collection requires keen planning and a deep understanding of different data types, its measurement procedure and sampling methods.
The project leaders need to ensure data integrity and accuracy by following best practices. Under the supervision of the black belt, the green belt and yellow belt will accurately collect the data in Measure phase of the DMAIC process.
There are 7 ways to speed up the data collection method for a six sigma project:
- Monitoring the baseline Metrics.
- Through process Observation.
- Collecting data via participation in the process.
- Automation
- Manual process
- Survey
- Sampling methodology
Monitoring the baseline Metrics:
Baseline metric is the starting position for any process or metrics from where the improvement/impact of change measure is calculated. Baseline Metrics is used to analyse the effectiveness of improvement or change initiative of process.
First and foremost is to figure out the question for which you want the answer.
We can share some base-level measurements that will give you an idea of how you can measure these things in piles.
The base-line question may differ with the type of features of your business or products.
For example: How large is your product? What part of the product is under your supervision?
What granular level are you interested now?
It all depends on the metrics we choose based on the type or stage of our product, the size of our organization and the business vertical we are in.
Few products, a feature may be a high-level activity. While for others, it will be a small collection of low-level occurrence. However, the difference is not so significant in comparison to measuring them.
After finding the answer from the initial question, will helps us in plenty of ways to analyze data. It further aids to ask more questions after getting the initial measurement.
What features are occurring more often?
Count of features: What are the key occurrence for features that we are interested in to analyze our Occurrence? What is the summation of feature usage over time?
In what way we can measure the number of events from Step #1 (series per event/feature). For users of a given feature, how often do they return to use it? How to measure:
What part of the monthly activity users has completed event X?
How shall we measure: — “count of users” vs. “ number Users who have done the activity in past 30 days” (or which segment of time is beneficial for you) — “Number of users” vs. “In the segment” and “Monthly Active Users” — Frequency.
Read About: Six Sigma Green Belt Course In Chennai
Through process observation:
This data collection method requires keen observation of the process. There is nothing better than manually observing and notifying what is happening in the process. Process observation requires impartial observation of the events taking place in the process.
A third party is appointed to observe the process such that impartiality is maintained. Impartial observation is important to eliminate waste and defects from the current process.
In a workplace environment, it is difficult to observe the work itself, since it is in form of emails, reports, phone calls and inputs to screens – not many work products are existing in a virtual sense.
As a result of this process, people are being observed and monitored on their activity. This creates friction with employees who will not like that someone is sitting on his head and watching his every move.
For this reason, only a trained observer from third-party who is not part of the work environment appointed to maintain neutrality with workers.
Normally, such a specialist are trained blackbelt who had never work in this area before they come from some other area.
It also requires office staff to join in setting goals for observation and deciding when the observation will be done. Who would volunteer to be observed and so on?
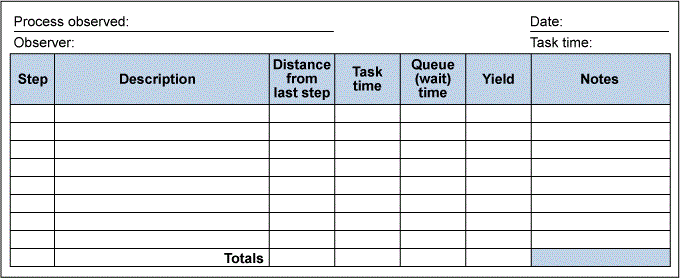
Below example, A form that Lockheed Martin used in the inception stages of improvement projects. This form used to verify or refute workers ideas on what they think is happening, and for assisting them to zero-in on areas that need attention.
Collecting data via participation in the process.
Another way data collecting method is by participating in the process. Till now we have seen how that data was collected by observing and analysing the internal process. If you would like to evaluate how a customer is looking at you and your process then what is the better way to evaluate your service or product than by acting as a customer to that service or products.
You can easily find a group of employees who could walk the process physically by posturing themselves as an item of the work.
For example, an incoming call. What happened to the record of the call? Who will work on it next?
Read About: Six Sigma Green Belt Course in Hyderabad
Automatic data collection:
Electronic chart recorders and digital storage are used for Automatic Data collection. The data collection method’s frequency may be eighter synchronous, based on a set time interval, or asynchronous, based on occurrence. In terms of cost, the automatic system is on higher side initially in comparison to manual data collection methods and also has a disadvantage of collecting good or bad data. However, it has some advantages like the accuracy rate is very high plus it can be operated unattended
Manual Methods:

In this type of data collection methods are not only labour intensive, but prone to human errors in measuring and recording the correct values
Since it involves human sometimes it can be very costly also.
Survey:
The survey is a very popular data collecting method. It has three categories depending on the type of data we require.
- Open-Ended
- Binary
- Categorical Preference
Normally such surveys are used to gather data for a qualitative purpose.
An Open-ended question:
Open-ended question will have a very expressive answer from the customers. The customer will have the freedom to respond in more details. However, the analysis is a bit difficult as the customer has given his perception in the answer, which could also be misread.
Example of Open-ended questions–
Why have you bought this product?
What qualities do you like about the products?
What qualities do you dislike the products?
Then, we can review the response from the above questions-
- Aggressive price or the product worth the price
- A good reference for the products
- Value for money
- Because of Warranty
- Good brand and quality
- Product is compared to none other
Theses answer will then be interpreted by a team and put into categories like-Price, brand, qualities, customer service.
There could be possibilities that one response can have multiple categories.
The team will review the response and try to develop consensus to the categorized response. If some of the response founded not fit can be termed as miscellaneous. If the miscellaneous response is too many, then this question needs to be more specific.
Based on the count in each category, the Black belt/Green belt can provide the team results in the form of a percentage, mode, ranking
Binary :
In this category, there are only two choices to choose from. The respondent will select one answer from the choice offered.
Example of binary:
Do you prefer tea hot or cold?
?What is gender
Do you prefer travelling by train or by roads?
Will you recommend this product to your friends? Yes/No
Read About: Six Sigma Green Belt Course in Kolkata
Categorical Preference Questions
Categorical surveys use a number to classify and there is meaning in the difference
It is Ordinal data and therefore it’s one level higher than the lowest level of data, refer as Nominal data
1 = POOR
2 = FAIR
3 = AVERAGE
4 = GOOD
5 = EXCELLENT
Other Questions Are:
What you consider the most important? Price, Quality, Warranty, or Service?
What are your preferred products? White, black, or pink?
You can easily count and categorize but few times the responses are not the best choice or ideal answer of the respondents.
Sampling:
In this type of data collection methods, a small amount of representative data is taken and measured to understand a large population.
Sampling is done when it is not possible to include a larger portion of the data to be studied Example Population of the country. It is also because collecting data is either very costly, time-consuming or not possible.
Sampling further classified into two-
Probability sampling and Non-probability sampling
Probability: It is the most reliable methods of sampling, the error of margin is very little due to statistical procedure. It so happens that you can choose every component in the population that has an equal and independent opportunity.
There are four ways of probability method
- Simple random
- Stratified Random
- Cluster
- Systematic
Non-probability sampling
This data collection method is not as reliable as a Probability Method. The selection process in Non-Probability sampling is Non-Random Methods. This results in the attributes in the population do not have an equal opportunity of getting selected as part of samples. The chances of having sample representative are less than the probability sampling. But many types of research have non-probability methods and made it a success.
Non-Probability are of three type
- Convenience
- Quota
- Purposive
In the end, we have covered all the points that are relevant to the title we have chosen. So we have to stop here. We spoke about Six Sigma, its origin and explain to you what are the data type and data collection method. Also, we discussed different belt level in Six Sigma which is also common lean Six Sigma. We are hopeful that after reading you are equipped with information to further explore or would help you evaluate the SIX SIGMA certification course for joining.
Recommended Reads
- Best Six Sigma Course in India
- Best Six Sigma Courses in Bangalore
- Best Six Sigma Black Belt Courses in Delhi
- Best Six Sigma Courses in Chennai
