
You can analyze exactly where your traffic comes from, what your visitors are like, and how they engage with your website. You can understand exactly how effective your marketing efforts are and if they’re providing a return on investment. You can also easily pinpoint ways to improve your strategy even when you’re already performing well. There’s always room for improvement.
 Book Free Strategy Call
So let’s talk about how we take this massive amount of data inside Google Analytics and turn it into valuable, actionable information.
Make sure you’ve set up goals
I’ve talked about this subject a few times, but it’s worth repeating. Google Analytics offers lots of tools to track your business’s performance. However, to get the most out of them, you need to customize them for your business. Setting goals is a perfect way to begin your customization process.
There are four different types of goals you can use to track your content marketing results:
If you’re not familiar with how to set up goals for your site, Google Analytics will walk you through it.
It’s important to set up goals so that you can see whether your efforts are actually resulting in what matters to your business.
1. Utilize on-site search queries
It’s easy for a website to quickly become huge. After all, an e-commerce site can have hundreds of product pages. Add a blog onto that, and you can see how a site can become enormous. After all, the current recommendation is to publish at least 16 blog posts a month.
That’s a lot of content!
When someone has that much information in front of them, how are they ever going to find what they’re searching for if they didn’t land on it directly from Google? One of the best ways to help your visitors and keep them on your site is to provide a search bar. This not only helps your audience but also provides you with valuable data. Google Analytics helps you tap into this data through their on-site search terms report.
With this report, you can easily review which keywords people are searching for on your site. Then, you can compare this info with the keywords you’ve been targeting. It’s possible that you have relevant content that you should update to include this new keyword. Or, maybe you’ll discover a gap in your content. This will help you find out what additional content you can create to build more engagement and drive more traffic.
After all, you know your target audience is already looking for it.
Another possibility is that you see high traffic to a particular page within your internal search. You can use that knowledge to do any of the following:
- Target those pages with campaigns, especially if they’re also converting well.
- Link the high-traffic page to some of your lower-performing pages to boost their traffic.
- Restructure your site to make these pages easier to find. For example, you could turn them into featured posts.
How to check for on-site searches
Log into your Google Analytics account. On the left-hand side under “Behavior” reports, go to “Site Search” and then “Search Terms.”
This will bring up a dashboard that shows you all of the search terms that visitors have completed on your site.
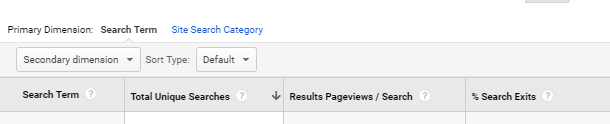
It will provide information about the number of unique searches and your exit-rate percentage.
A high exit rate may indicate that the current content coming up for that search term isn’t what users are looking for.
2. Check your mobile strategy
People are using their mobile devices more and more every day. With that in mind, you should plan for your mobile visitors. But you can’t just implement without checking to see if it’s working or not.
Log into your Google Analytics account and look under the “Audience” section on the left-hand sidebar.
Locate the “Mobile” tab.
Expand it and select “Overview.”
This will allow you to see how your site is performing on mobile devices.
And if you’ve set up a goal that relates to mobile traffic or mobile conversions, you can pull it into this report as well.
On the far right-hand side, select a goal completion for Google Analytics to display next to your mobile performance breakdown.
Then you can see your conversion rates and total goal completions for any given time period.
If the mobile version of your site is performing poorly compared to your desktop version, it could mean that your site isn’t optimized for mobile.
And since Google has already begun mobile-first indexing, if your site doesn’t perform well on mobile devices, the effectiveness of your content marketing will be impacted.
Make sure you drill into the mobile report to see traffic and conversions across mobile devices.
This will tell you if you have a mobile-wide issue or if your site is just poorly-optimized for one operating system.
If it’s mobile-wide, you will need to optimize your site for all mobile queries and devices.
If, on the other hand, it’s simply one operating system or one version of one operating system, the fix will depend on your site development and the OS changes.
3. Optimize your site speed
According to Google, the majority of sites are too slow, regardless of industry.
The current ideal benchmark is three seconds for page speed loading time, yet most sites are above the nine-second mark.
This is important to recognize for two reasons:
- Speed directly impacts your bounce rate, as can be seen in the image above.
- Google announced that page speed will be a ranking factor in mobile search as of July 2018.
Having a slow site can kill your chances of ranking in SERPs and tank your traffic. But before you can try to fix the problem, you first need to be able to diagnose it. Not every page on your site will take the same time to load. Using Google Analytics, you can pinpoint the specific pages on your site that need the most improvement.
This way you can save time and gain some quick wins by targeting your slowest, top-performing pages first.
How to monitor page speeds
Log into Google Analytics, and under Site Speed, select Page Timings.
This report quickly shows you all of your pages on-site, grouped by page load time.
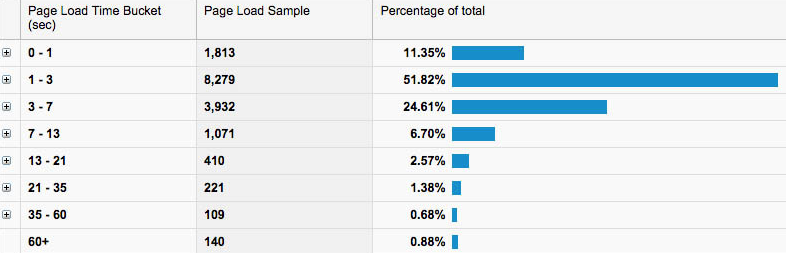
You can then analyze to see the specific pages in each bucket.
Want more advice on how to improve slow pages?
Back in the left-hand menu, also under Site Speed, is a Speed Suggestions report.
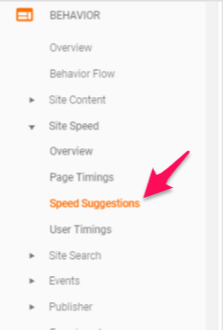
This will give you some specific suggestions you can implement to improve your speed.

Google also offers another tool, PageSpeed Insights, for even more free help in optimizing your page speeds.
4. Understand your customers
Understanding your customers helps you personalize your content for them.
68% of firms have already made personalized experiences a business priority.

Why?
Well, it’s a great way to increase revenue and profits by tapping directly into your customer’s wants and needs.
You can start to understand your customers better with Google Analytics’ Affinity reports.
How to view your affinity reports
Open Google Analytics and check out your left-hand menu.
Under the Audience section, you will find the Affinity Categories report.
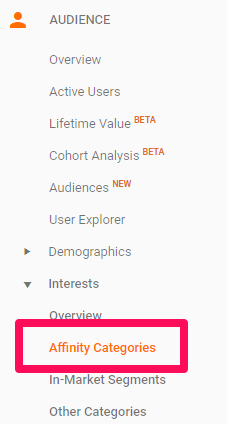
This report helps you analyze common buyer trends. 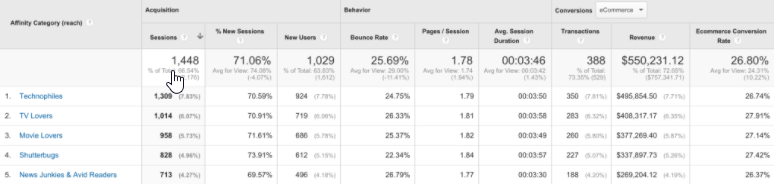
Check out which affinity groups have high traffic and low bounce rates or high conversions on your site.
You may find that you do really well with a group you never expected to target, such as TV Lovers.
This knowledge can help with future content marketing and ad campaigns.
Another report to help you understand your customer base is the Audience Data report.
How to view audience reports
This time under the Audience section, you’re going to select Overview rather than Affinity.
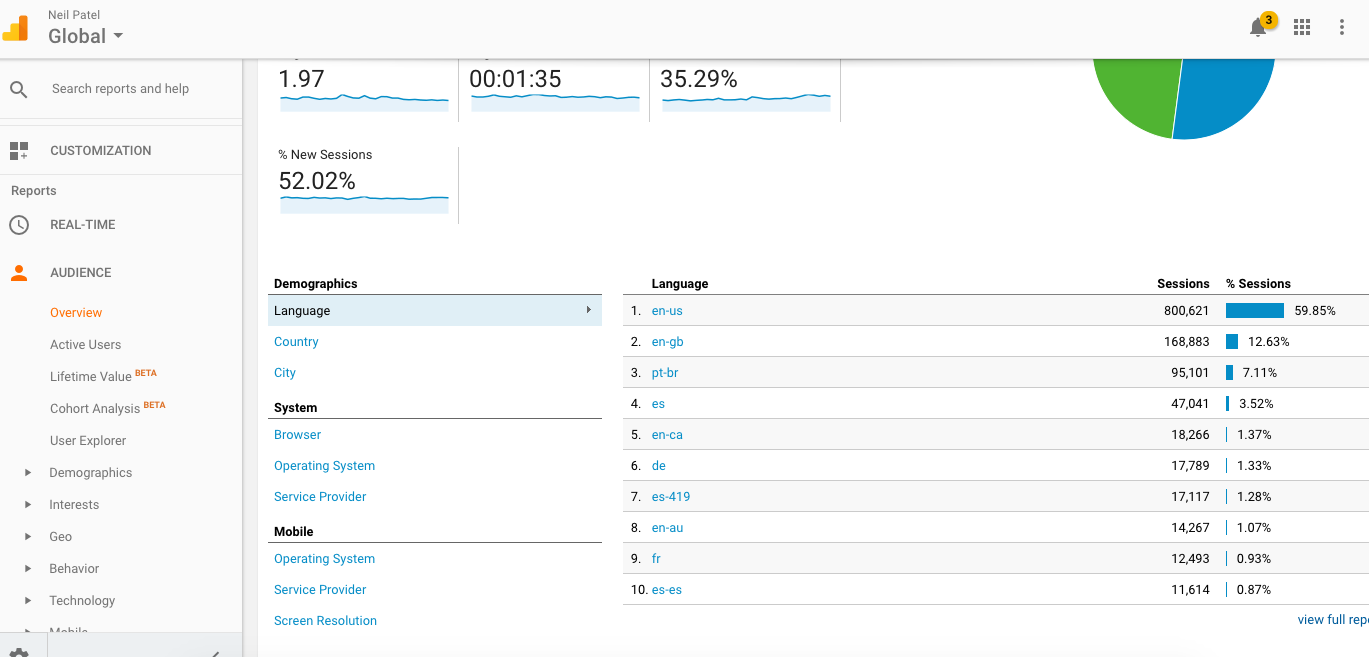
This is a broad overview.
It doesn’t go into a huge amount of depth about your customers, but it helps target some general areas that may be of interest, such as language, device, and location.
If most of your users are from the US, or even from within a few states in the US, that information can be very helpful for marketing.
You can further analyze your customers by adding some additional demographic and interest data.
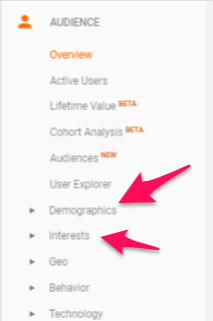
Demographics give you customer information such as age range and gender.
Interests are exactly what they sound like. This report tells you some of the things your customers are generally interested in.
You can then take all this information and combine it to build customer personas for marketing.
5. Focus on searcher intent
Searcher intent simply means the reason for why someone performed a search.
There’s a pretty old, but still accurate article that breaks searcher intent into three broad categories:
- Navigational intent – when a searcher is seeking a specific site such as Facebook or Amazon.
- Informational intent – when a searcher is looking for answers or researching a specific topic.
- Transactional intent – when a searcher is ready and looking to have a transaction such as “best Chicago pizza near me” or “how to check in for a Southwest flight.”
Of course, this doesn’t cover everything, and people may not also neatly fall into just one category.
However, it’s a great way to start understanding who is coming to your site and why.
You can begin to understand the intent of your traffic by looking at the Overview of Acquisition report in Google Analytics.
How to check you acquisition overview
In the left-hand menu, under Acquisitions, select Overview.
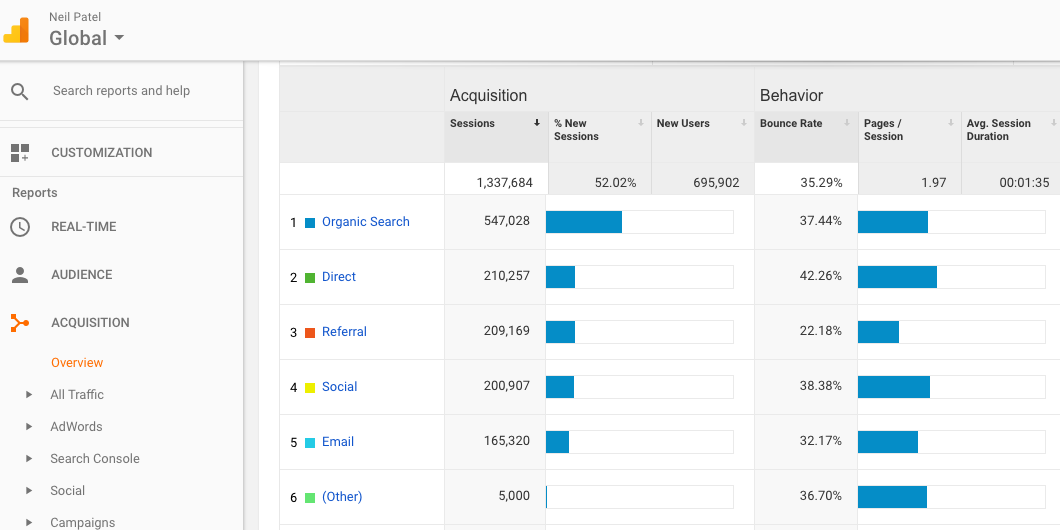
In this report, you want to focus on organic traffic. The other results could be skewed by promotions and other marketing efforts.
If you click on the word “Organic Search,” it will provide you will additional information:
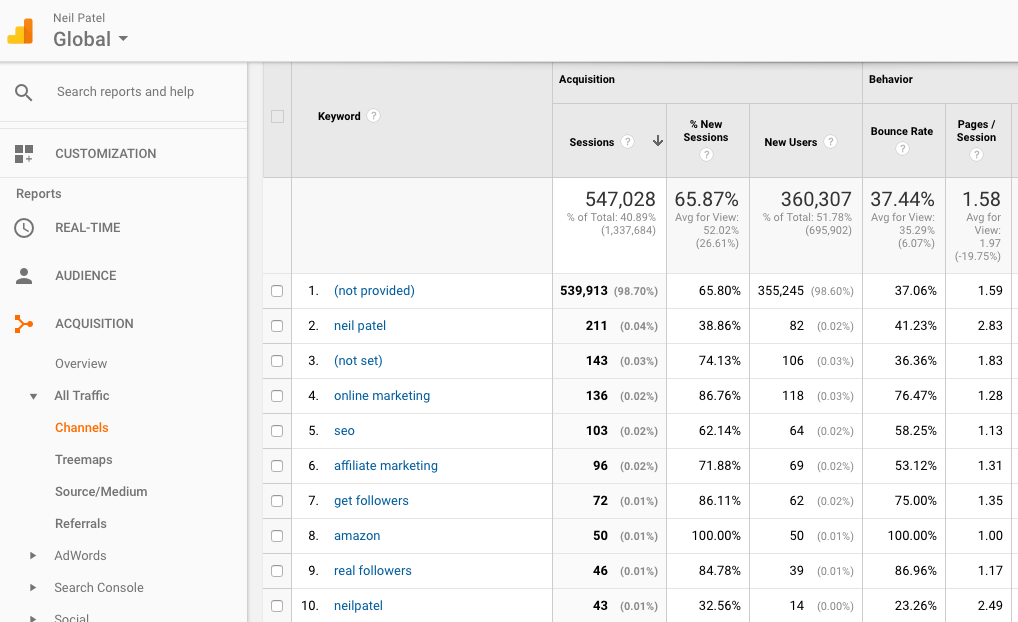
Now you can see a breakdown by keywords searched.
It shows you a vast amount of data, including highest volume, bounce rates, and average pages per session.
You can then use this information in your next content marketing campaign.
For instance, are you receiving a lot of traffic for informational intent searches but not transactional intent?
This could mean you need to boost your conversion efforts and your marketing towards bottom-of-the-funnel searchers.
6. Visualize your traffic funnel
A typical conversion funnel used to look like this:
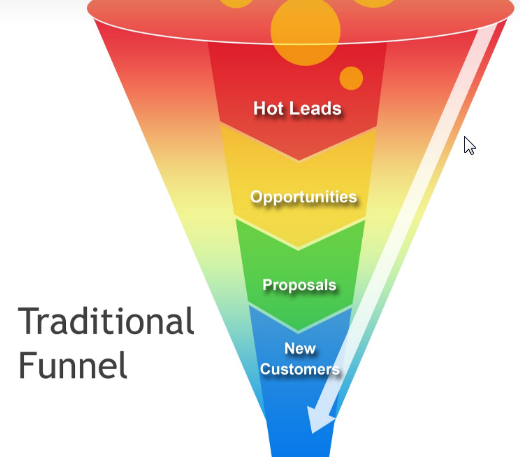
Now, it’s more like this:
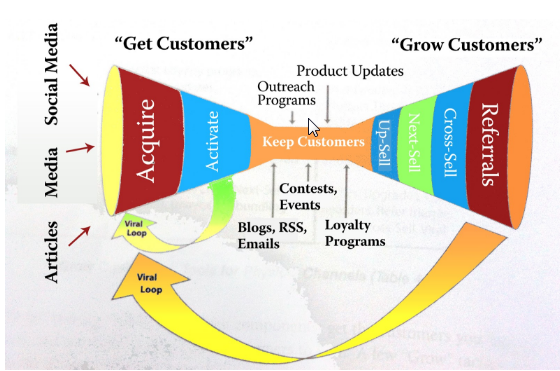
Add in the quirks of individual customers, and the ways users can escape a funnel, and it gets even more complex.
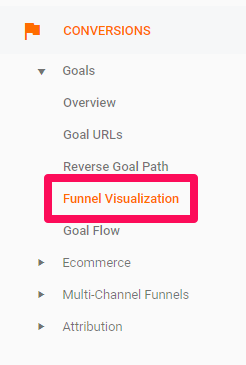
This is why being able to visualize your actual site funnel can help you understand how well your content marketing strategy is working. It can help you understand which site pages correlate well with each funnel stage. It also helps pinpoint which paths convert well and which ones need work. This Funnel Visualization report is in the Conversions section of Google Analytics.
It’s important to note that this report only works if you have already set up some conversion or sales goals in Google Analytics.
How to visualize your funnel
Under conversions, select Goals, and then Funnel Visualization to see the report.
Then select your relevant conversion/sales goal at the top of the table:
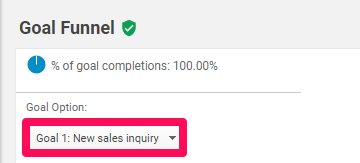
Now the report will show you a visual representation of what that sales funnel looks like:
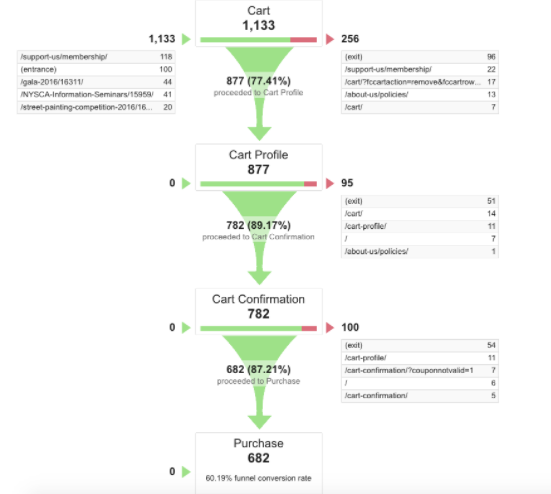
As you can see in the example above, it will show you specific pages that Google Analytics believes line up to each funnel stage based on customer activity.
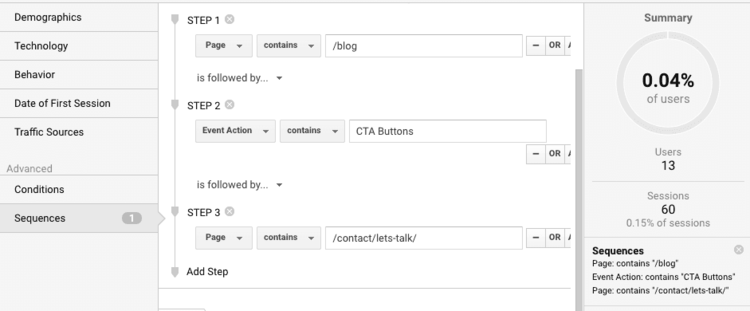
Another way to look at your funnel is through Sequential Segments.
How to use Sequential Segments
This is a type of advanced segment that can be used for measuring a sequence of user actions. For example, a sequence could be landing on a blog page, clicking a CTA button on it which goes to the contact page, and then submitting the requested opt-in form.
You can create segments to report on just like you create goals to measure against.
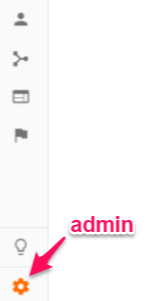
Go to the Admin section:
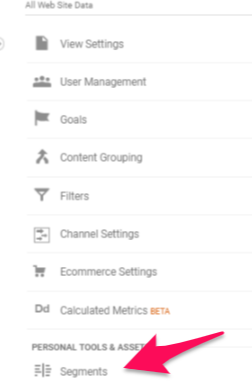
Then on the far-right, under personal tools, select Segments:
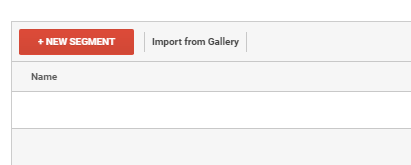
Select New Segment.
Then choose Sequences under the Advanced options.
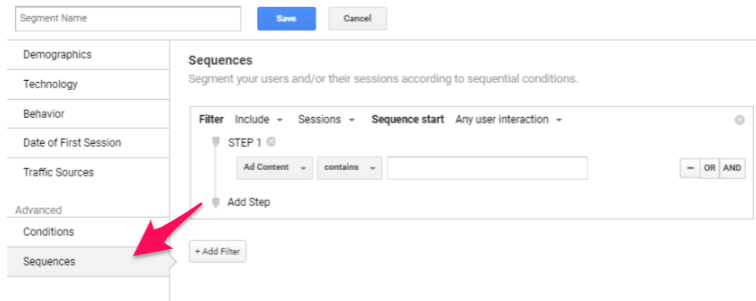
Now you create the funnel steps or customer actions that you want to track by inputting the path.
These can be useful to help understand user behavior for different lead pages.
It can also help identify which of your blog posts lead to the most conversions.
7. Focus on your current traffic sources
There are a lot of different possible traffic channels these days. Search engines, PPC ads, social media, and direct search are just a few. Where your traffic is coming from may affect how they are engaging with your site and your content.
You can use the Google Analytics Source/Medium report to see how many sessions you have by each source. It can also tell you valuable data like the number of new users and bounce rate.
How to view your traffic by source
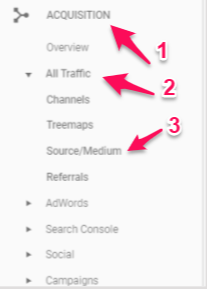
Back to that left-hand menu, under the Acquisition section, go to All traffic and the Source/ Medium.
You’ll see a report showing you a summary of interactions by source.
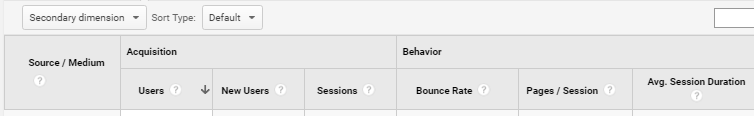
You can also add in secondary dimensions such as Acquisition behavior to make the data more meaningful.
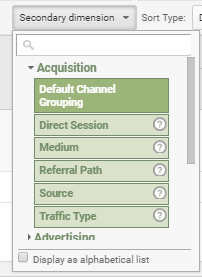
For example, you can see all traffic from Google that was organic only .(removing Google PPC ads).
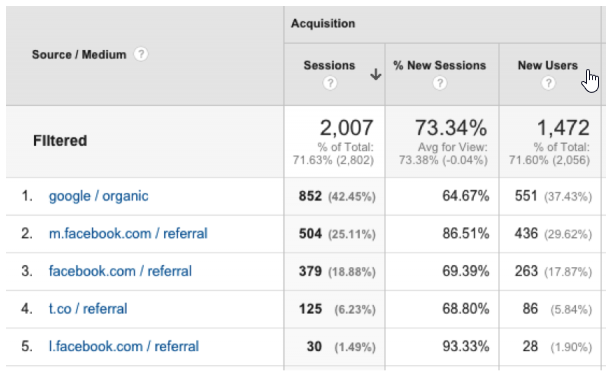
Now you can easily see what referral traffic or traffic types drive visits to specific landing pages.
This helps you target the platforms that are driving the most traffic to your site.
8. Pinpoint high traffic, low engagement pages
High traffic is a good thing. Right?
What if you have a ton of traffic coming to your site and then just leaving again? Is it still good? Traffic without engagement or conversions is ultimately useless. Don’t worry! Though, if you’ve already successfully gained the traffic, then you’ve won half the battle.
Pinpointing those pages which are high traffic, low engagement is a great potential quick win for boosting conversions.
There are a few ways to do this, but one I like to use is the comparison feature in Google Analytics.
How to find high traffic, low conversion pages
Just go to Behavior, then Site Content and Landing Pages on the left-hand menu.
This will bring up all of the pages people land on within your site.
Then you can use the comparison feature on the right-hand side of the screen.
You can select a Goal Conversion Rate if you have one set, or you can choose Bounce Rate from the drop-down menu:
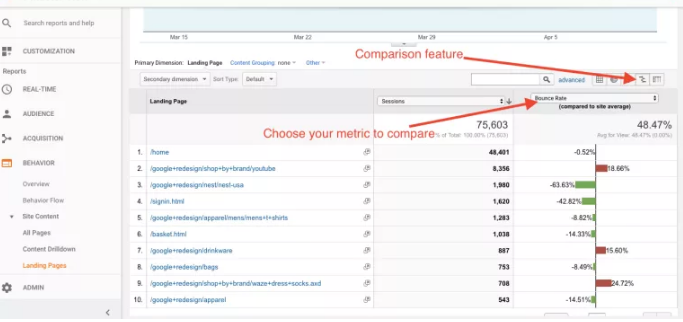
This will allow you to compare conversions or bounces across all pages. You can easily sort by the ones with the highest number of sessions to find the high traffic, low engagement pages, so you know where to focus your efforts. If you want, you can also narrow your results down even further. For example, you can reduce the search to show only your blog pages.
It’s easy to do this using the search function within the report.
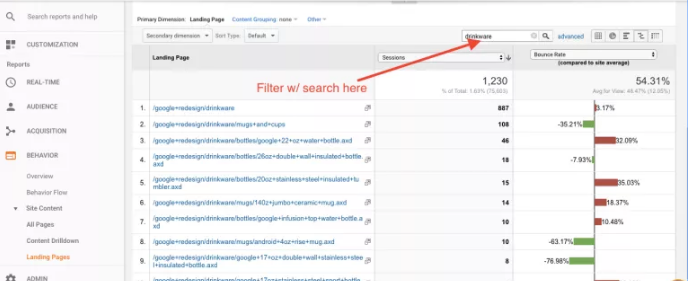
Now you know which pages to target to improve your conversions.
9. Know when you should publish content
Exactly when you publish your content matters.
There have been many studies done on when the best day of the week and the best time of day is, across all platforms.
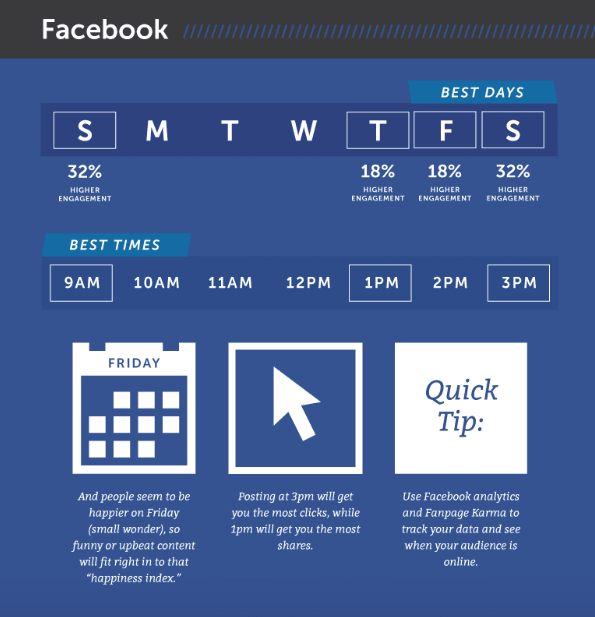
But just because a study says it’s the best time on average, doesn’t necessarily mean it’s the best time for your audience or your business. Thankfully, Google Analytics can help answer this!
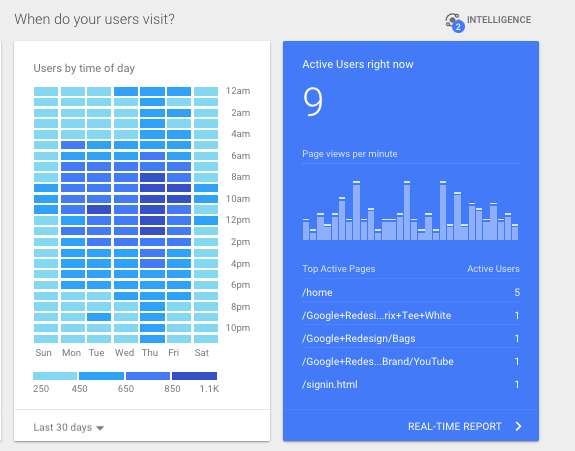
First, they provide a simple heat map right on the homepage for you.
The second option is to use Google Analytics custom reports to create your own. The benefit of this option is that it allows you to customize the variables.
How to set this up
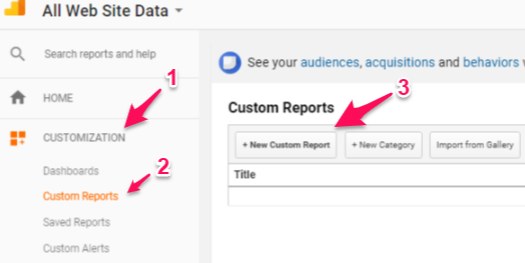
First, go into the custom reports section of Google Analytics and choose a new custom report.
Choose the “flat table” option.
Then add in the dimensions “Day of Week Name” and “Hour,” and then any additional relevant metrics you want.
For example, you might want to include the volume of sessions.
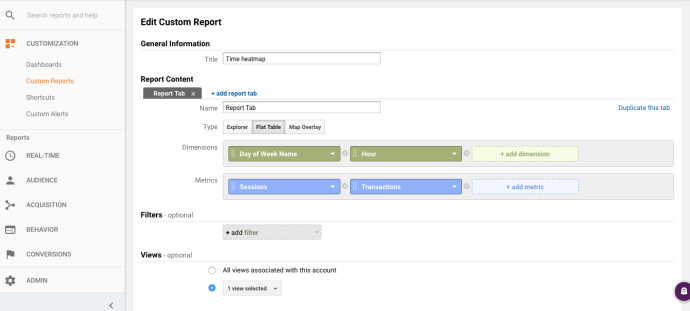
You can also add things like Source/Medium to narrow it down to organic sessions, or Device type if you want to separate mobile from desktop.
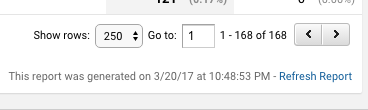
Once down, Save and export your data to Excel.
Make sure that you choose “show rows” in the bottom right-hand corner of your screen.
Then, within Excel, you can use the pivot table option to begin to turn the data into a heat map.
Make your columns the Day of the week, your Rows the Hours. Then your Values should be whichever metrics you chose, such as Sessions.
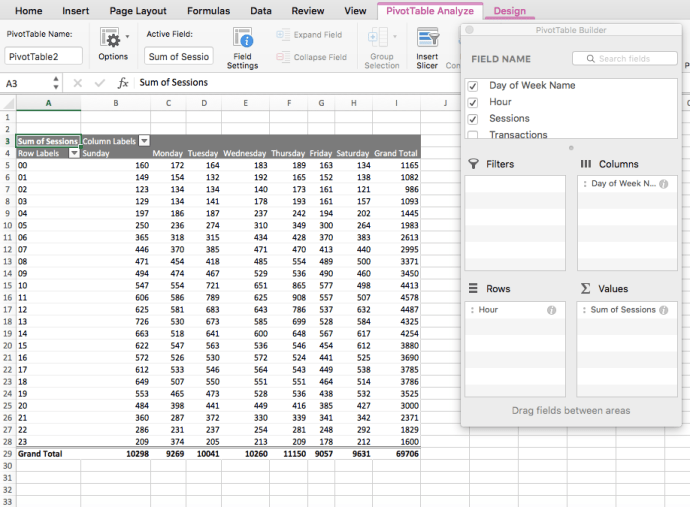
Once you have the pivot table, you can use some conditional color formatting to make it look like a heat map.
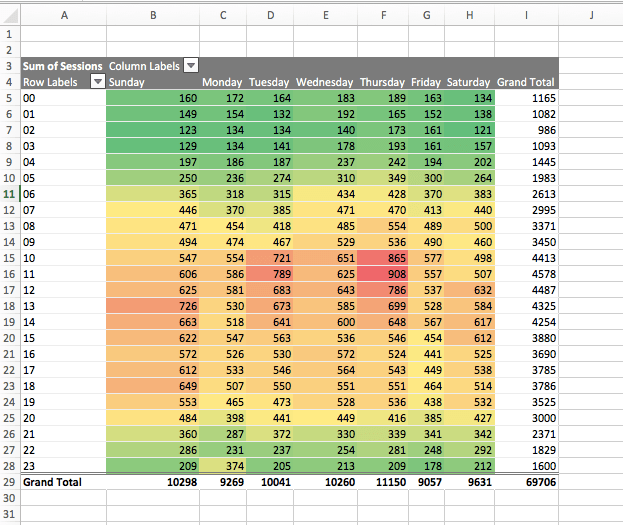
This gives you a quick and easy way to see when your visitors are checking out your site.
If you find traffic is heaviest between 10 am and 1 pm on Tuesdays and Thursdays, then you should target publishing your content on those mornings, before 10 am.
10. Track your ROI
I’m guessing that you’re not just doing content marketing for the fun of it.
That means you have a goal in mind. Something you want to get out of your effort.
So, how do you know that your content marketing strategy is paying off? Tracking your ROI will help you in finding the gap between the expected goal and result.
Check out these methods and find a difference in the results what you used to derive before and now!
Recommends Reads:-
- Latest Analytics Jobs in India
- Top 10 Marketing Analytics Courses in the USA
- Top 10 Marketing Analytics Courses in Singapore
- Top 10 Marketing Analytics Courses in Bangladesh
Also Check this Video
Ready to Start Your Learning Journey?
Join thousands of learners and build your future with expert-led courses and 100% practical training.
- Expert GuidanceLearn from industry experts
- Trusted & RecognizedTop-rated by learners
- Flexible LearningOnline & offline options
- Placement SupportCareer support & more
